I have no sound running whatsoever. Still I have a gameobject with a few soundcomponents.
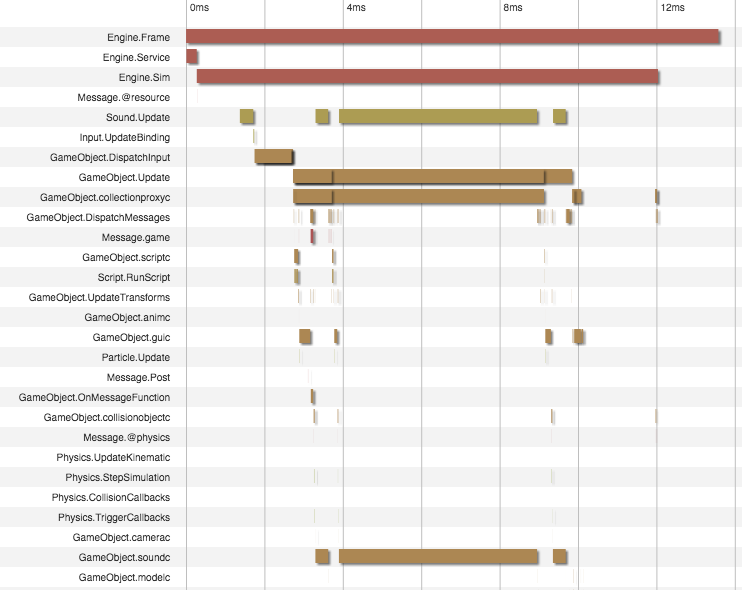
Looking in the webprofiler trying to catch weird fps spikes I see that the Sound.update is constantly lying on 2 ms and spike at 6-7 ms.
This is on iPad mini 2 (A1490)
Why is that?
Seems like using collection proxies does a bigger impact on performance than I previously thought. I will try to “bake” a few of them to see if also sound will be more performant. Still those spikes are really weird
As the documentation about profiler is kinda limited and I am not really sure exactly what the different tags are I will make this thread more open for all kinds of spikes, because they are occuring at very weird places and blocking the frames
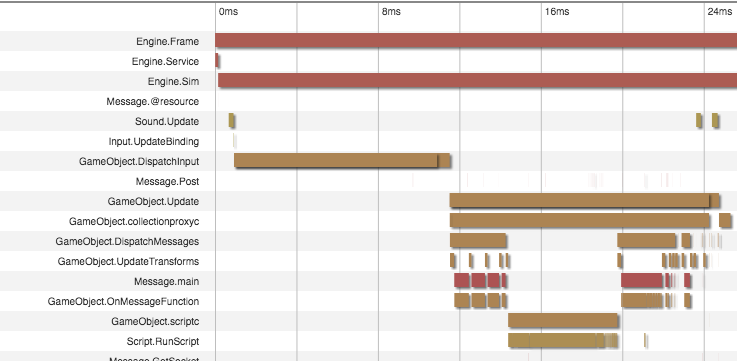
Here I get this input spike every now and then (lasting half a frame):
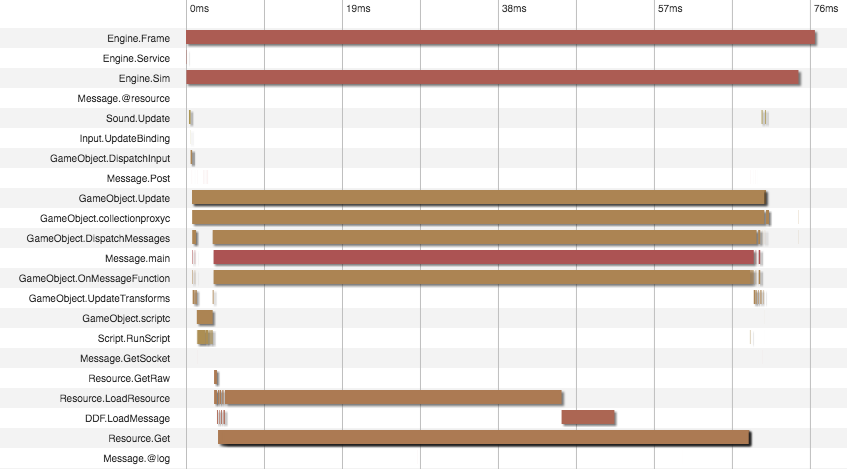
Also this one is really hard and I’m not sure what Resource loading is (no loading whatsoever is taking place in core game play). Is it something that has to do with collectionfactory creation? +60 ms !!!
GameObject.DispatchInput.
This will call on_input in active scripts. Have you checked if there’s anything in those callbacks that could consume this sort of time?
Resource.Get
Resource.Get is called when a resource of any type is created. A collection is a resource and if you create a collection with a collection factory it will create all objects and (sub) components it contains. ~60ms a lot though, but I can’t say more without looking at the resource setup..
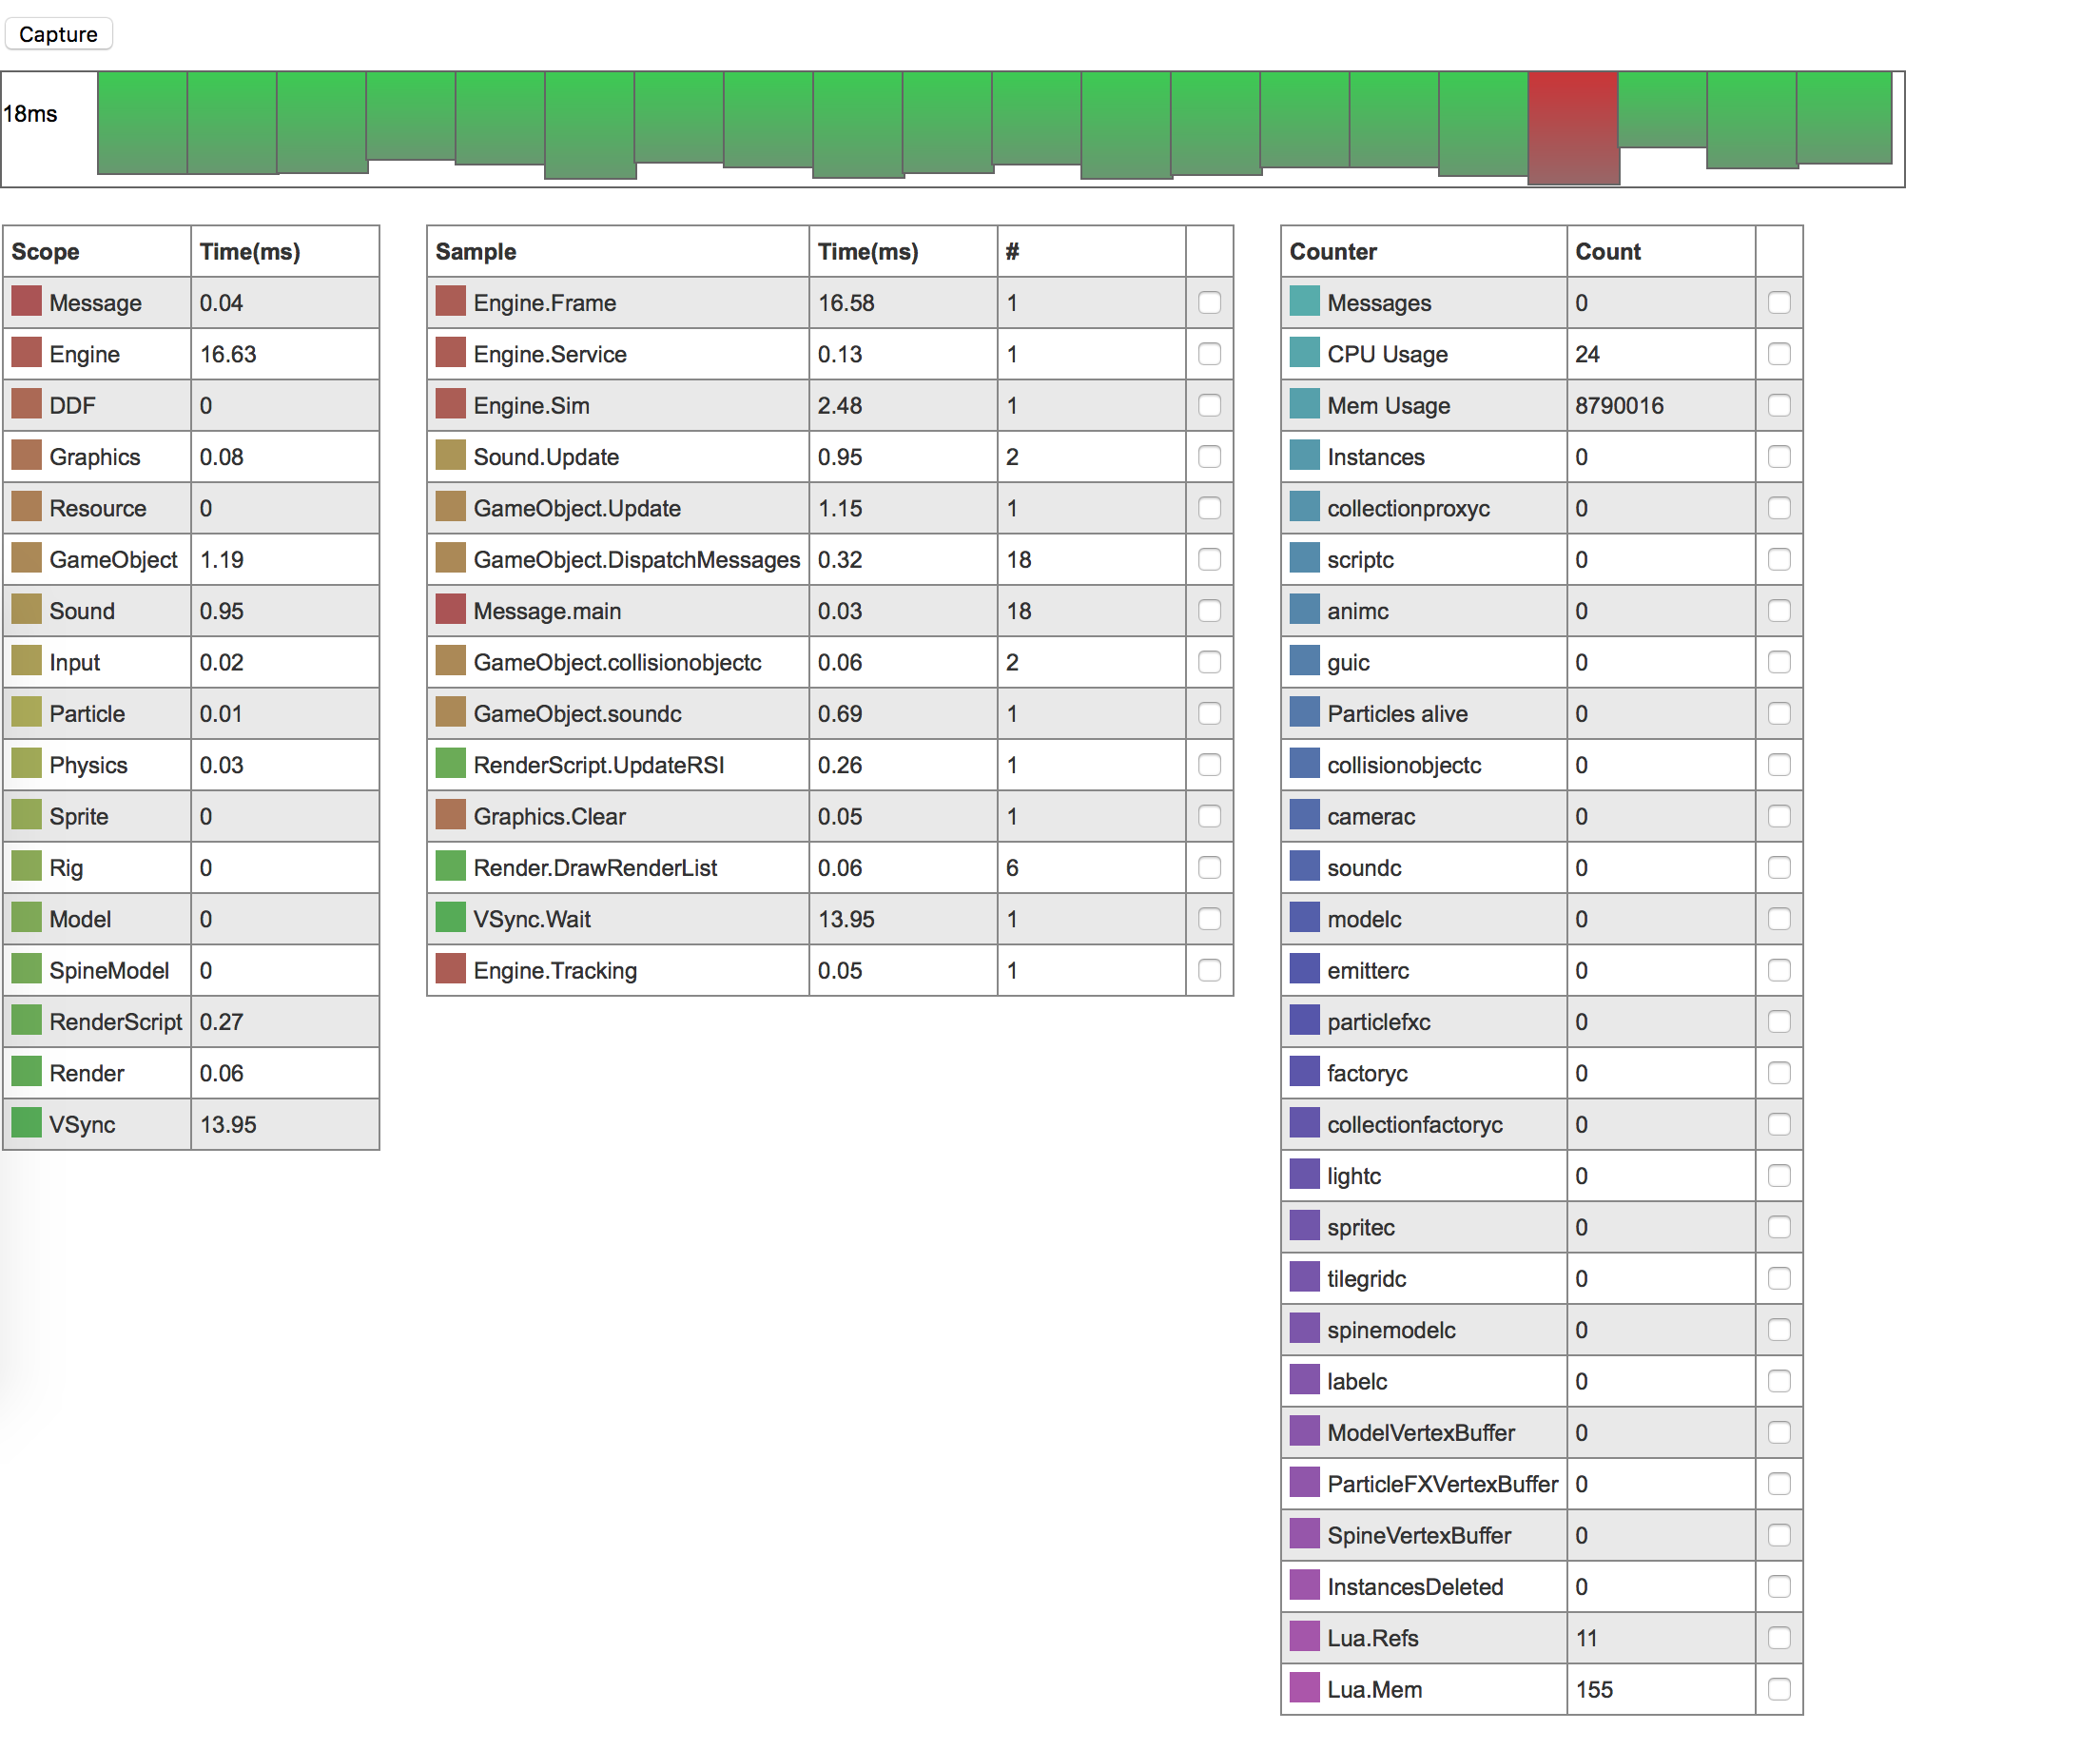
32ms spike: It seems to me the GPU frame takes > 16 ms in which case it will need to wait to next VSync, which is at 32ms counting from 0. The frame time is max(gpu_time, cpu_time).
DispatchInput: I will double check as I do have 2-3 entrypoints for on_input()
Resource.Get : I have instances being created all the time. This happens very randomly and seems to go back to that single factory with one sprite and one script. Its hard to replicate. I might pop by the office and give you a look if you are there this week as I really don’t think it is a big creation.
32ms spike: So none of the Render tags in the profiler has anything to do with gpu? (Renderscript.UpdateRSI)
Great. I’m here all week. Leaving around 2.45pm on Thursdays.
We can have a look at the Resource.Get etc then.
The profiler does not measure GPU time in any sense, except for the VSync which of course is related since that’s the one (potential) sync-point to the GPU processing. The Render tags are how much CPU-time is spent to set up the rendering frame and subsequent OpenGL calls (which are in most cases non-blocking).
Sorry, you are fully right.
It was a part of my big investigation on the last week, and in my head it was a part of the same. Sorry for that.
But I found the same strange spikes when profiling empty project (just one empty collection) on ipad4 for ex. show strange 1ms for sounds or 2+ms for Engine.Sim
Ok. One more time in one post.
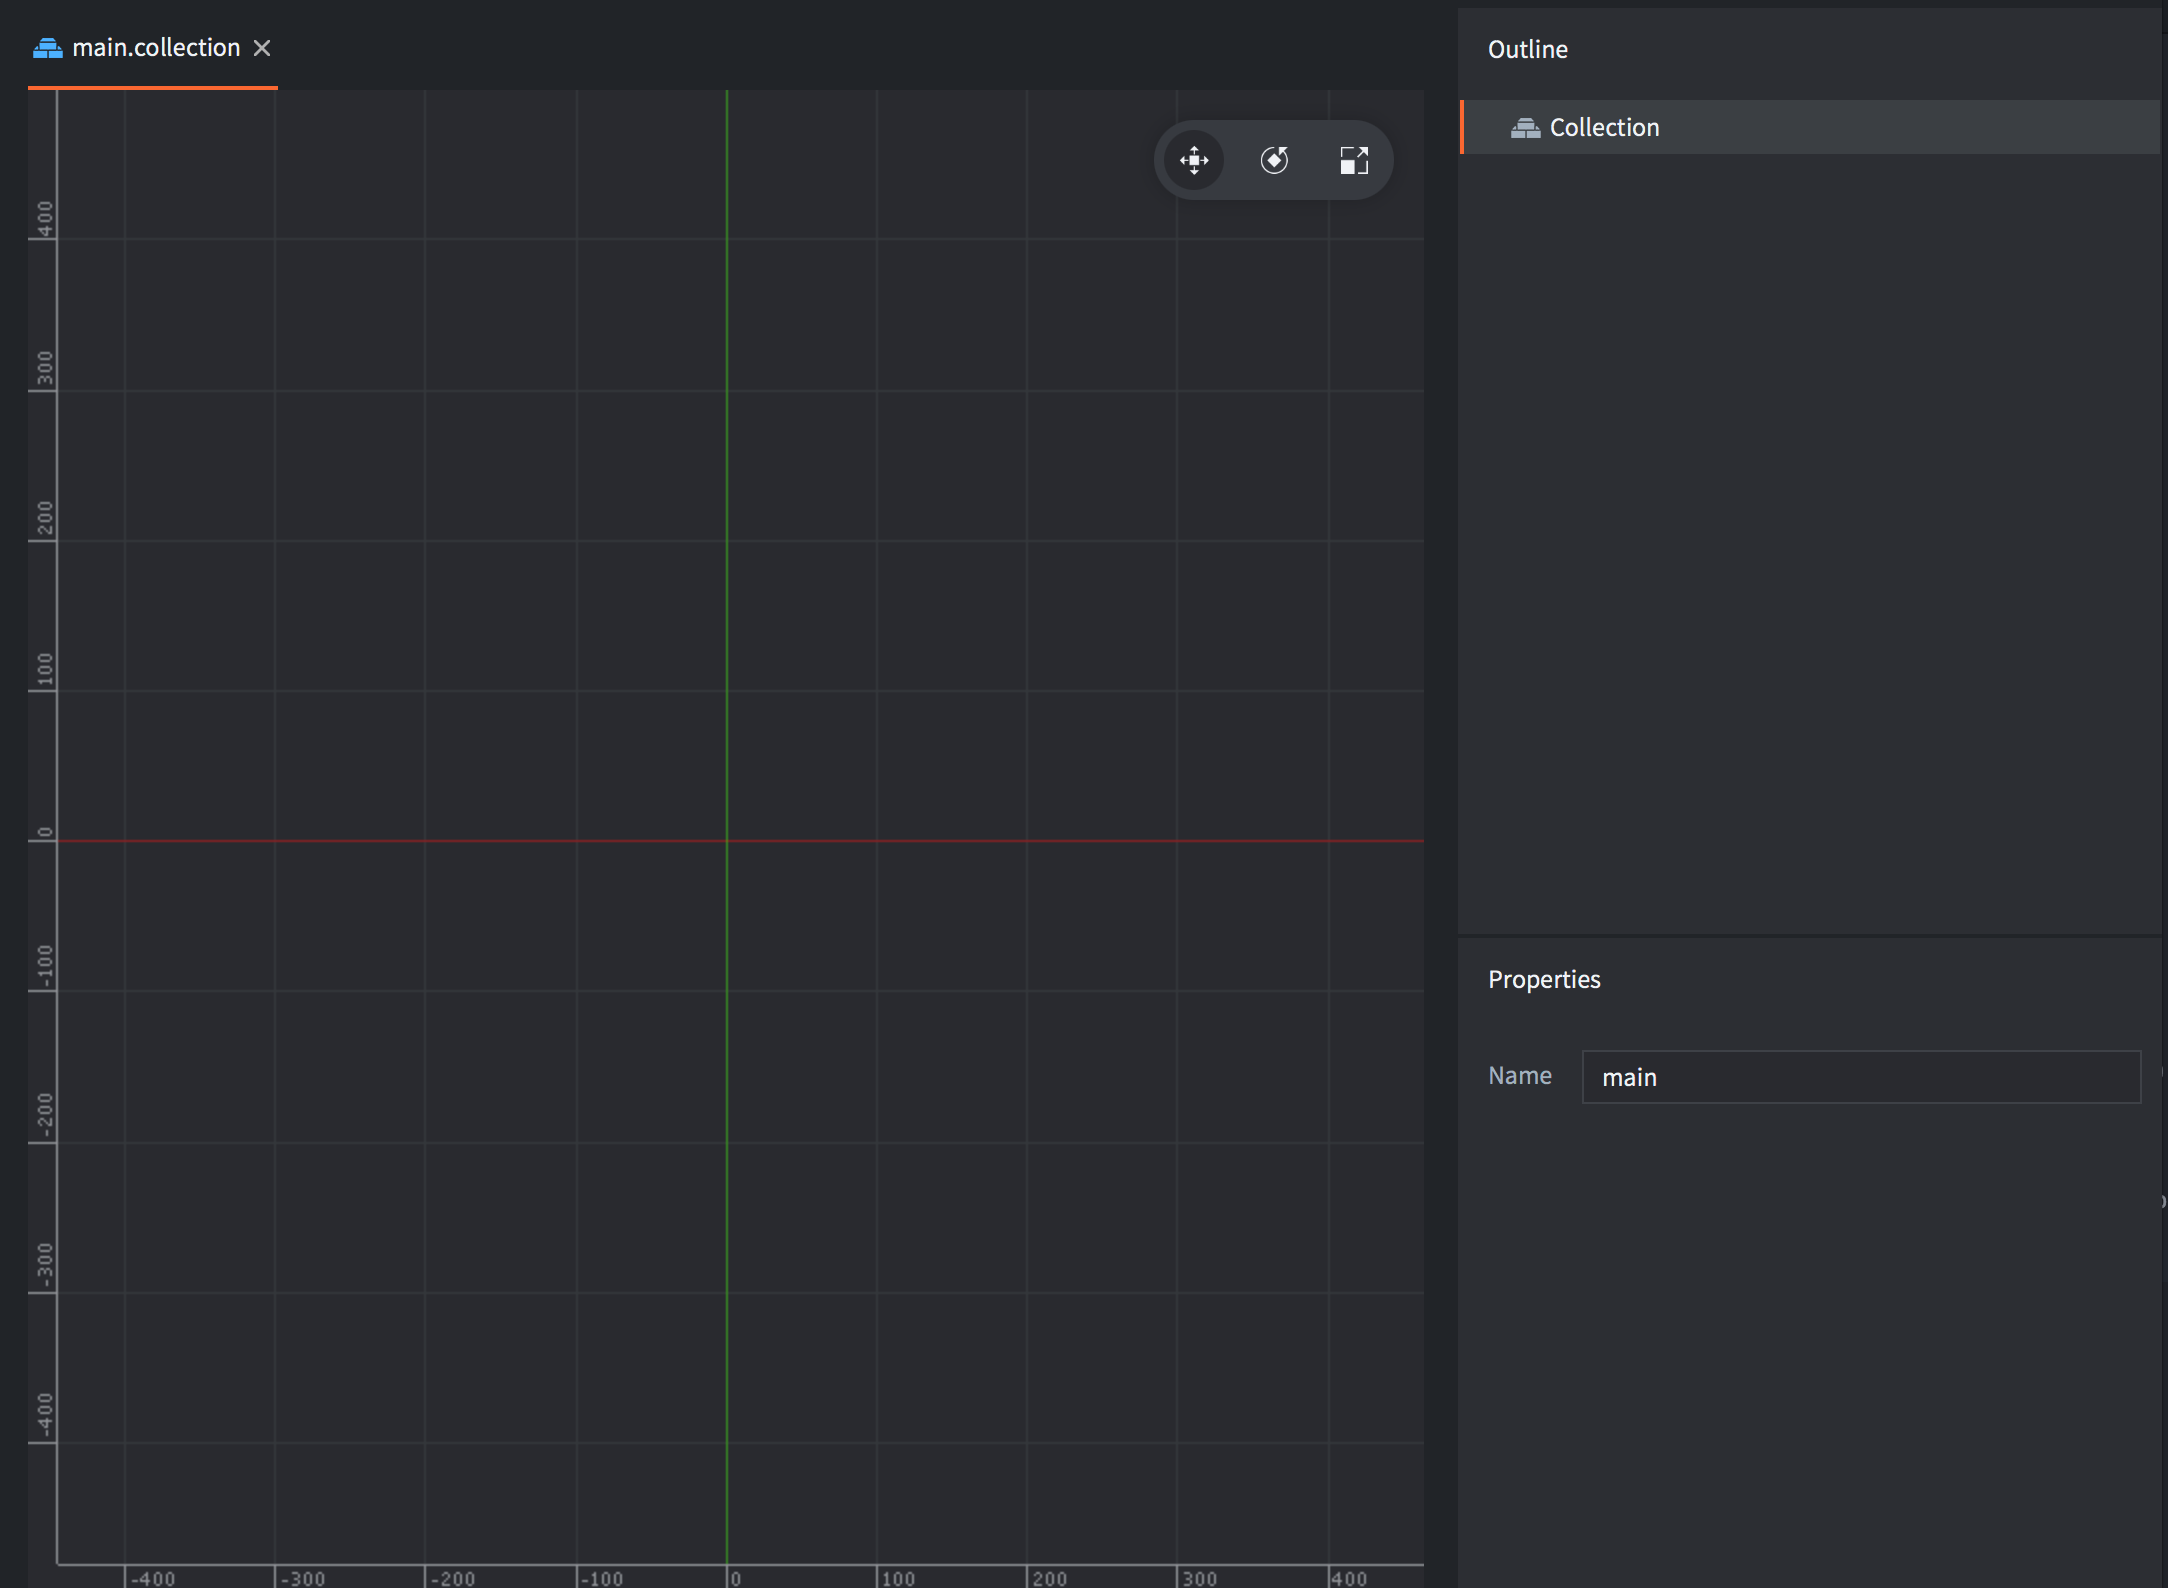
I am building empty project (I have input binding file with click and multi-tocuh, but have no scripts at all, and have no objects):
(project contain some other things from old tests but they didn’t used in main collection) test.zip (249.6 KB)
Installed this ipa to my iPad 4, and check using web profiler (in this time i tap to screen, i don’t know maybe it doesn’t matter… i just tried to understand why in main project i have serious fps drop when when tap to the screen):