Hey, just quick question. My game is running decent but only at about 25 fps. I check the web profiler and it says Engine.Frame is the main reason for the delay.
I’m just curious, where should I be looking in my code to optimize this? And is there any page or manual that explains these debug components in more detail?
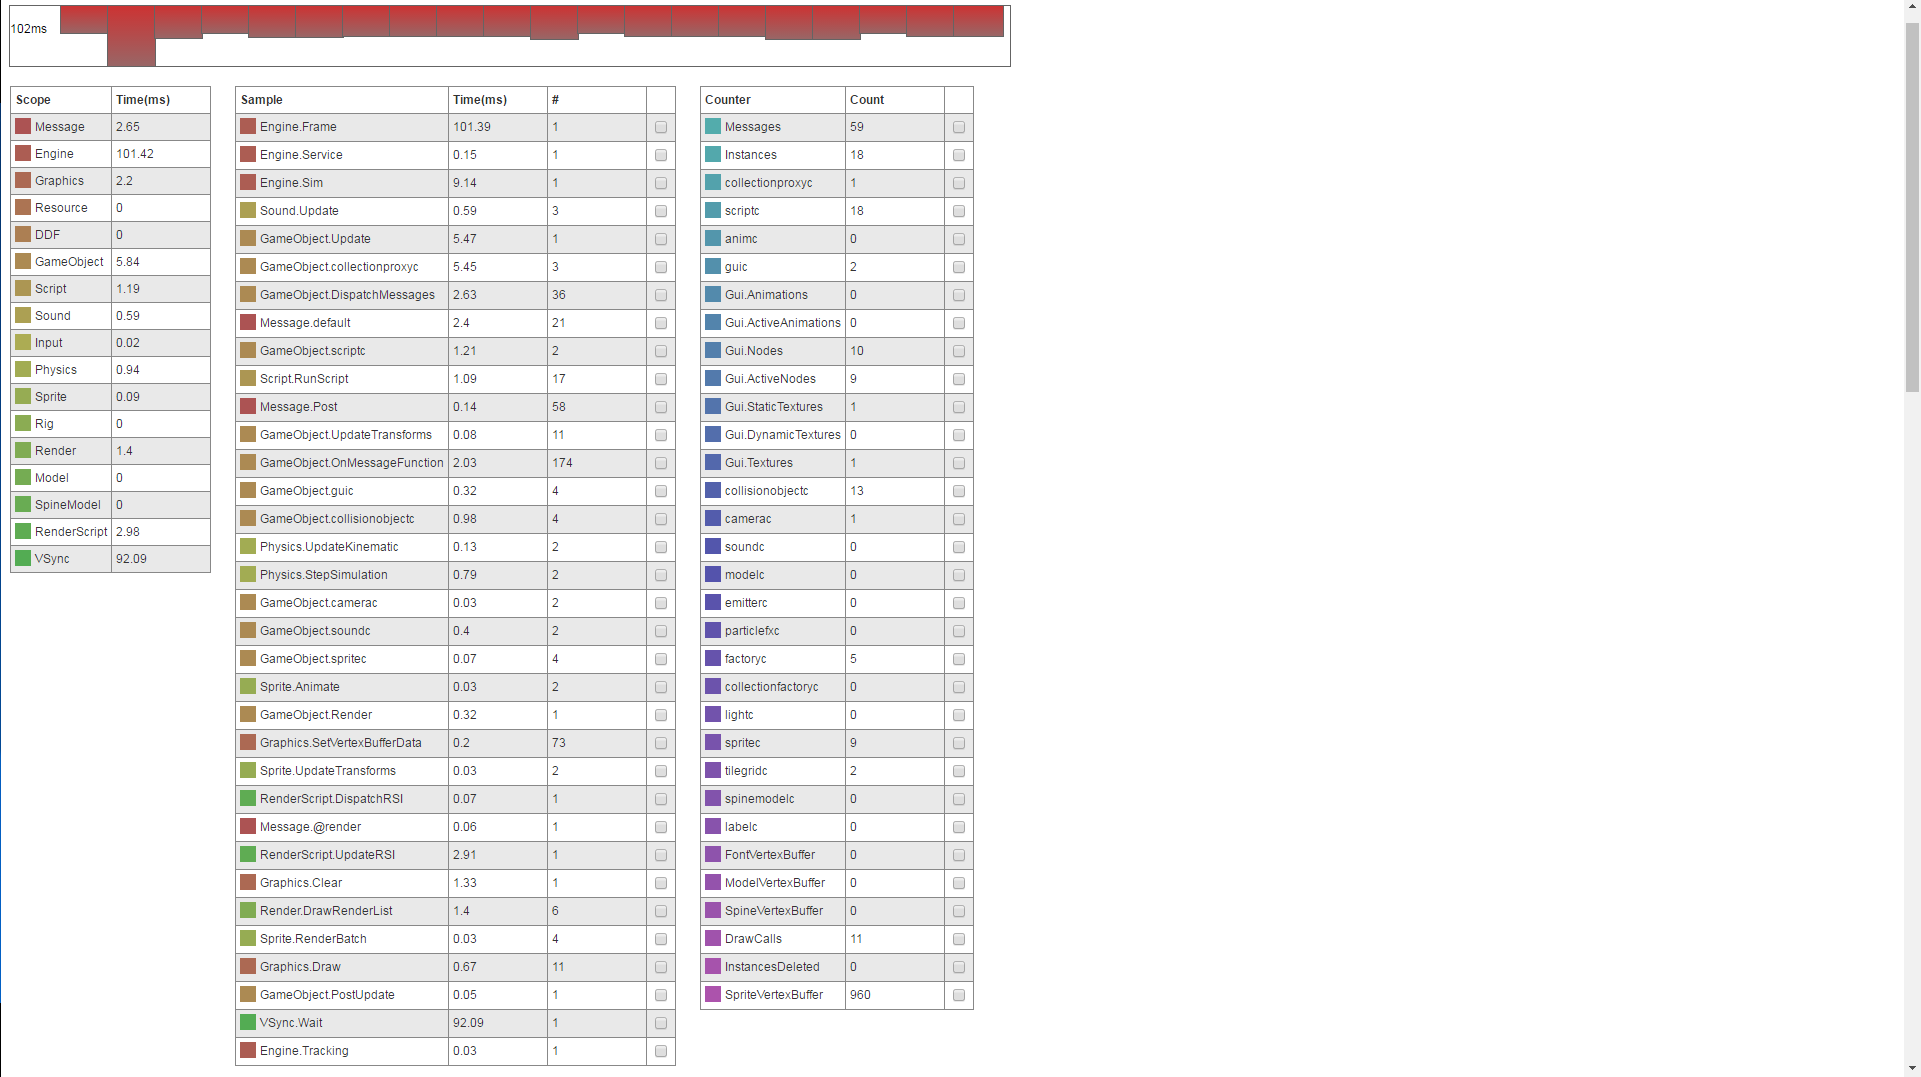
The scope Engine.Frame describes the time for the entire frame and should be seen as a total since it includes (almost) every other scope. If you go to http://www.defold.com/manuals/debugging/ and scroll down to the header Frame time chart at the very end, or open your webprofiler and scroll down to the very end, you can see a breakdown of where the engine spends its time during the frame.
So defold targets to keep fps at a max of about 30 fps correct?
Here is the profile. So most of the time is used waiting for vsync which is used to match monitor refresh rate to match the 30 fps. In the picture each frame is average about 50 ms so its running at about 20 fps and wont go any higher.
You choose what target Defold should keep its fps towards.
Check game.project file under display -> update_frequency. Is it set to something out of ordinary? Try setting it to 60 ?
No it is set to 60 and variable_dt is unchecked. Ive changed it to other values and it doesnt seem to change anything.
I did see the post about the bug with windows and update_frequency, but not sure if that is the problem here? I will try to reinstall my drivers and see
Yea sure. I’ve added you. Just so you known only part of my code is documented. I guess if you have any questions just let me know. I have no idea how good my code is.
I wonder if it’s a graphics card driver issue? Did you update your graphics card drivers? Do you have access to another machine to test on?
One thing I noticed (that probably isn’t really related but still something you should be mindful of) is the number of drawcalls. You currently have 11 drawcalls and you should obviously try to keep this value as low as possible. You use several small atlases (boulder.atlas, spider.atlas, slime.atlas etc). I suggest that you combine as many of these as possible as long as you don’t go above 2048x2048 in total atlas size.
I have my PC and laptop. Both are AMD computer with amd cpu and graphics cards. And both say they have the newest driver. However amd isnt doing much on driver support since the last time they made an update for it was 1 and a half years ago. They release more updates for the beta driver so let me install that and see how it works.
Also my PC has much better hardware than my laptop and its the one that has the worst fps drop… so let me try and see
I installed the newest driver possible. However it doesnt seem to have changed anything. Maybe my gfx card is too old? Idk, i don’t have fps drop in other games.
If your interested my setup is:
CPU: Amd FX 6100 (six core) 3.3 GHZ
GPU: Amd Radeon HD 6790 (which AMD considers a legacy card)
Unfortunately, this really looks like a bug in either Defold or your Gfx drivers. The engine simulation is around 8-10 ms, which should make the game run perfectly at 60 FPS. We then hand over to OpenGL and the GPU, and this is where the rest of the time is spent (45-100 ms). It’s incredibly unlikely that this is a result of how much you are drawing in your game, it looks more like stalls from driver configurations. Please try the following while checking what the profiler reports to get more info about the problem:
Run an empty game
Change the window size of the game
Move the game window off screen (we saw an issue in OSX a few years ago, where it only went at full frame rate if the window was slightly off screen).
Make a custom render script (info about this in the manuals and the forum) so you can comment out the different render calls and see if that changes anything.
Well I made a new project and empty the main collection than ran the game and the results were the same.
Empty Game - Average 38 ms
Shrunk window size - Average 35 ms
Move window off screen slightly - Average 36 ms
I haven’t got a chance to write my own render script, one being I haven’t even started researching the references for such a task, but if I get to that and test I guess I will post the results here.
PS. The results from above were run from my laptop which has a newer AMD GFX card, 38 ms was about the average for my game when I ran it on my laptop. My PC would average the same as before of about 60 ms
It seems like there’s some compatibility issue between the Defold engine and the graphics driver or something. Could you provide some details about the graphics card, the drivers and operating system?
CPU: AMD A10 - 4600M APU GFX: AMD Radeon HD 7660G + HD 7600M Dual Graphics Driver: AMD Catalyst 15.7.1 Direct3d: 9.14.10.01128 OpenGL: 6.14.10.13399 OS: Windows 7 Home Premium (64-bit)
Desktop:
CPU: AMD FX-6100 GFX: AMD Radeon HD 6790 Driver: AMD Radeon Software BETA 16.2.1 (New name for Catalyst) Direct3D: 9.14.10.1171 OpenGL: 6.14.10.13417 OS: Windows 7 Home Premium (64-bit)
Let me know if you need any other information from my setup