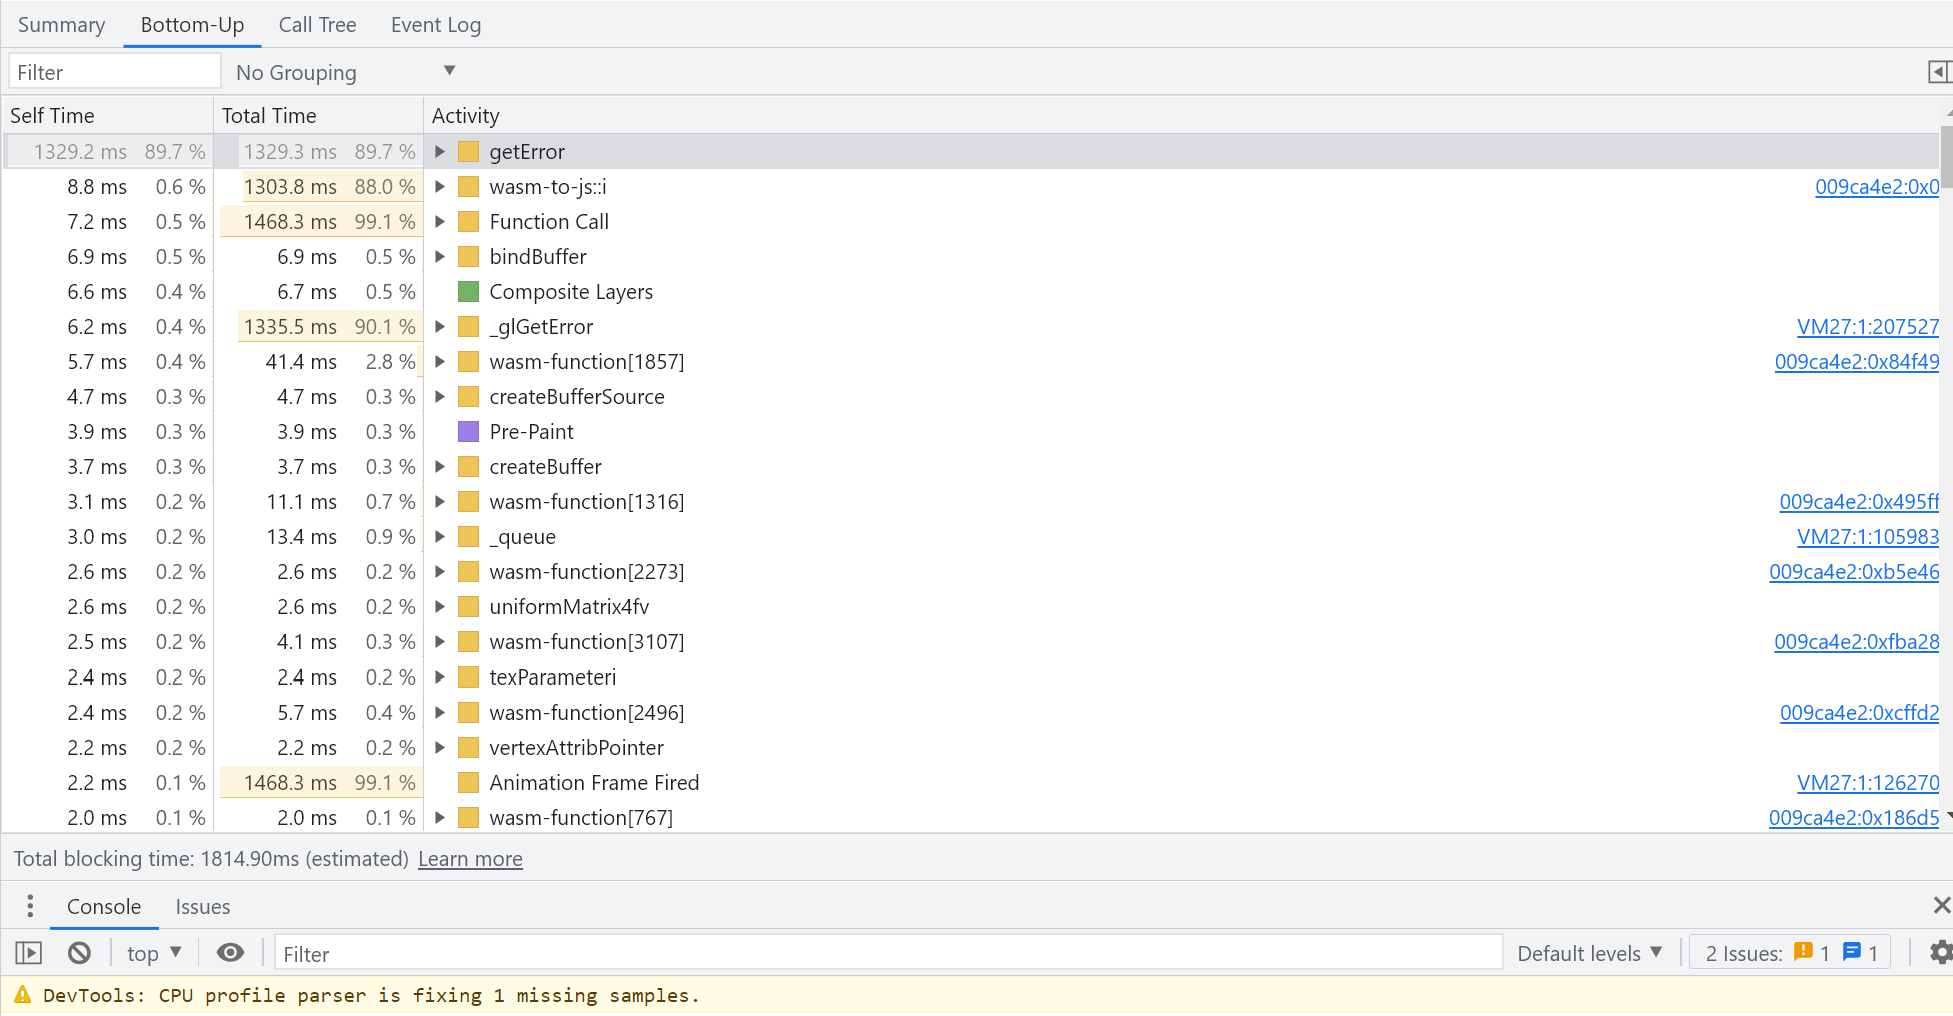
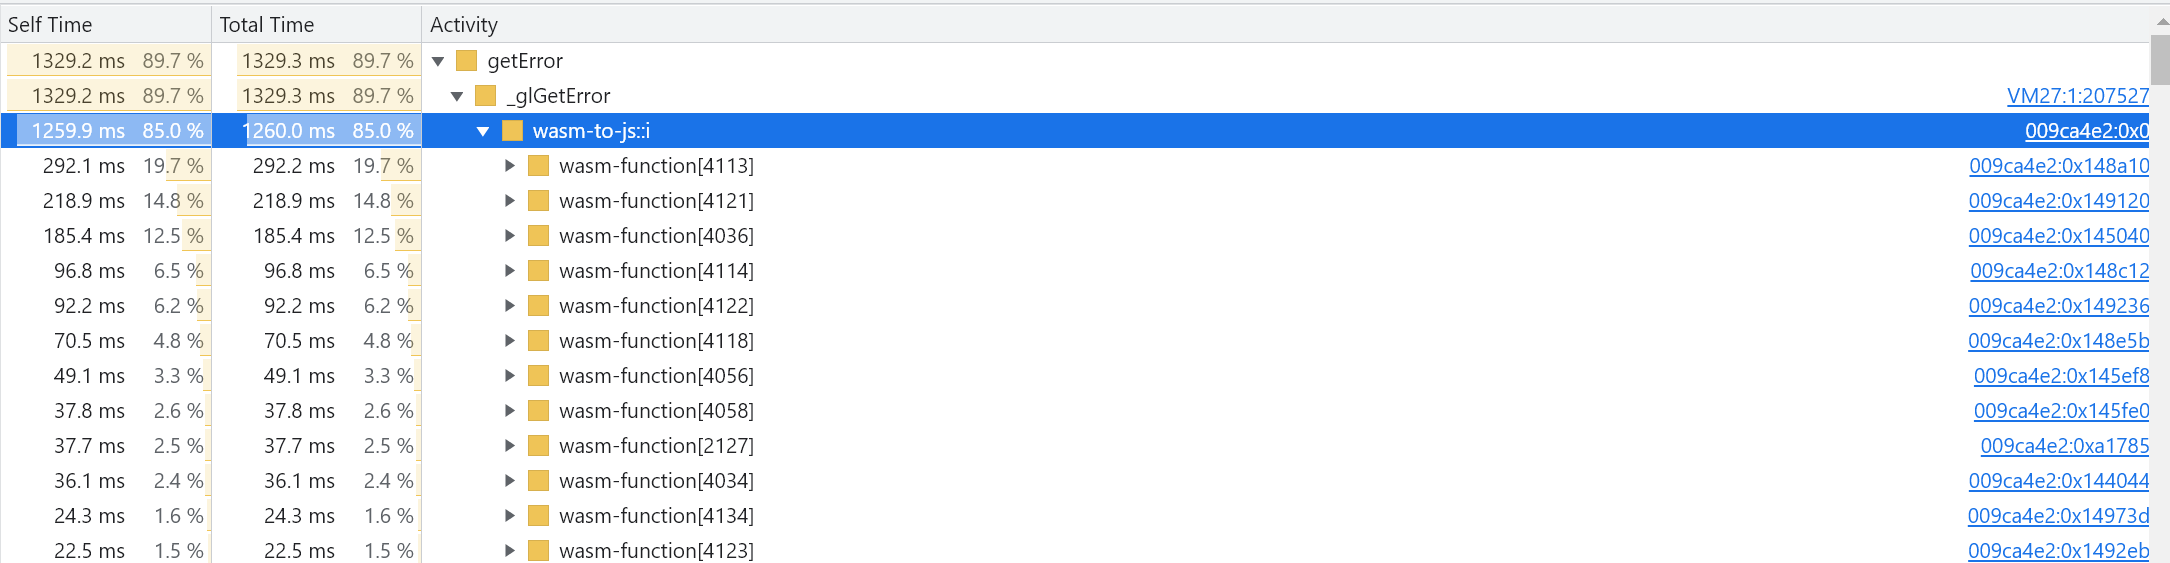
My html5 game runs very poorly on a few select devices and great on most. I’m trying to pin what the culprit is. Attached is a screenshot from chrome when the game is running at a very low frame-rate. How can I track down more about this getError that takes a lot of time?
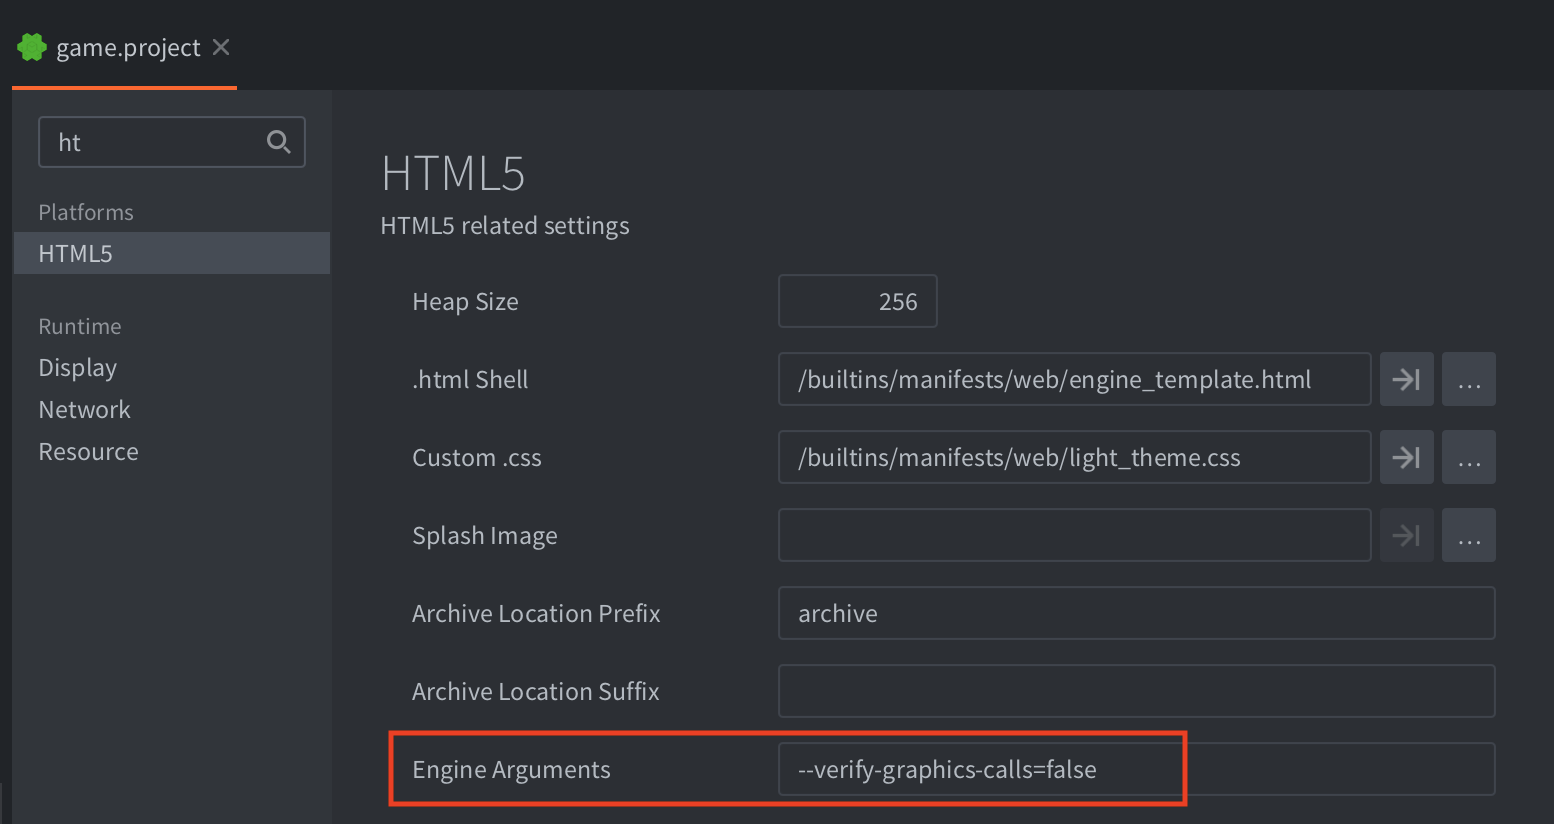
I believe this is caused by error checks on all graphics calls. This should be disabled by default. Check your game.project file in HTML5 Engine Arguments and verify that it has --verify-graphics-calls=false.
Thanks. It is already disabled like that.
Hmm, ok, are you using a custom index.html?
Yes I do and testing without it removes the error! Does the custom index.html not respect --verify-graphics-calls=false or does it point to me having a different error in the custom html?
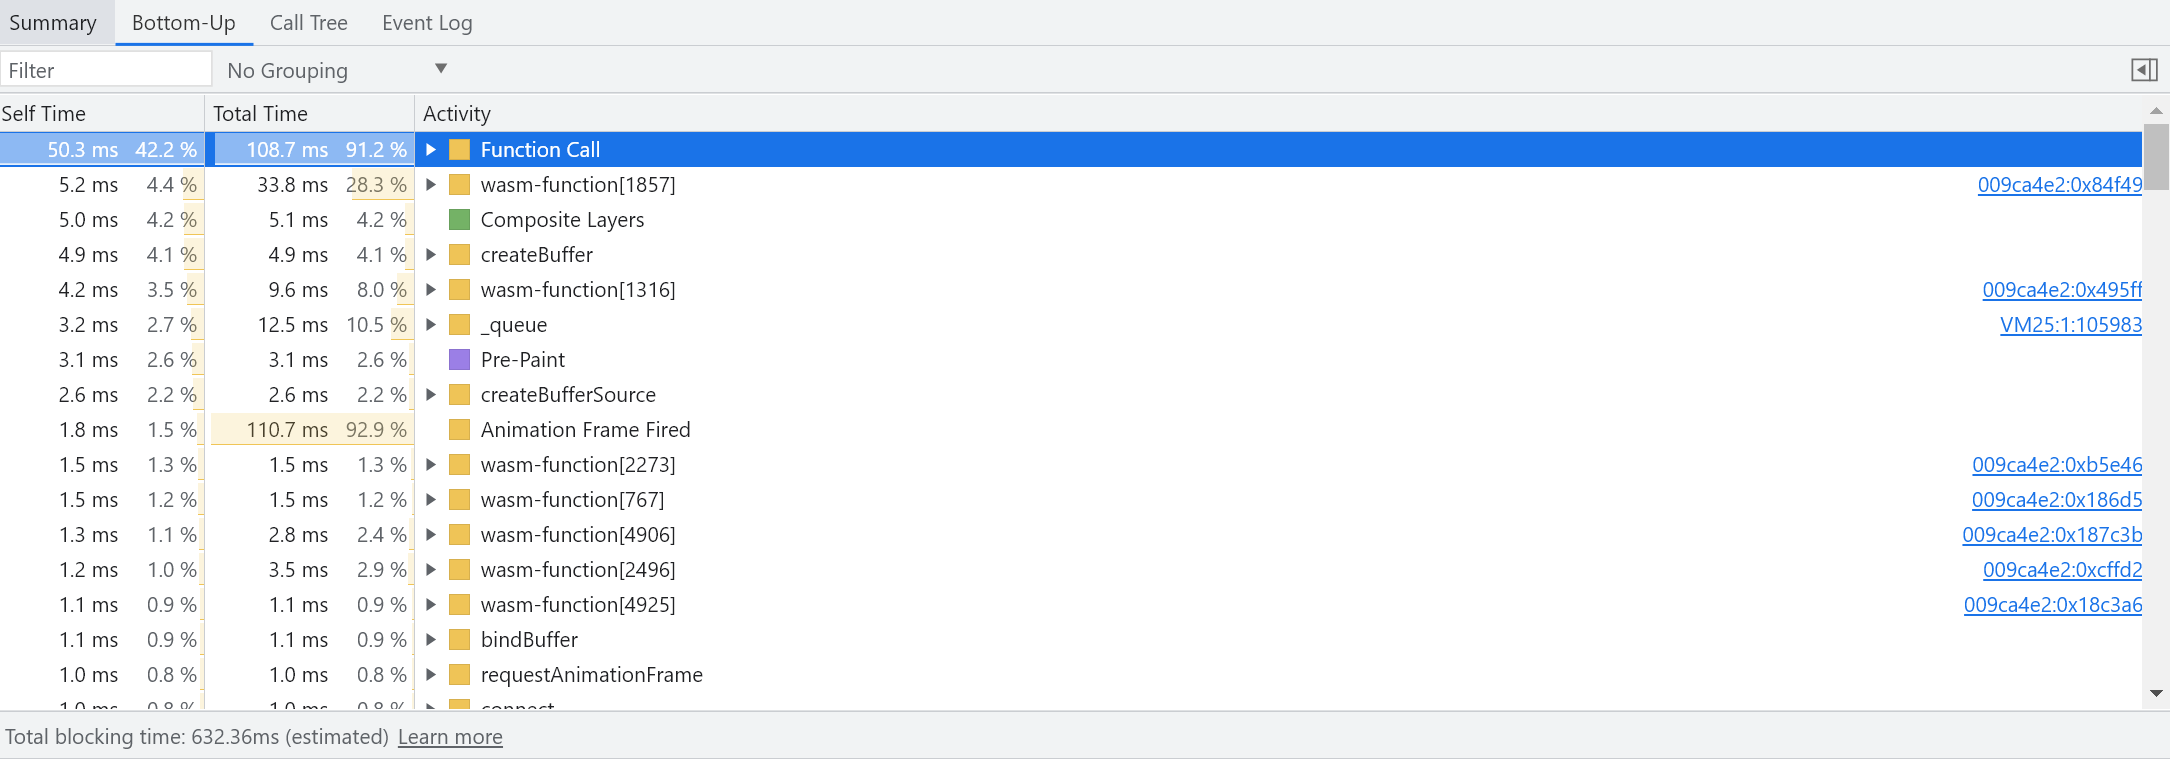
Perhaps a different question but on a more general term, the game without the custom index.html still has a pretty low frame-rate. Can I track what’s the next-most time consuming activity (see below)?
It seems like yours doesn’t. If you open engine_template.html from /builtins/manifests/web you find that this is a templated file where some values get replaced before writing the final file to the bundle location. In the engine_template.html there is:
	<script id='engine-setup' type='text/javascript'>
	var extra_params = {
		archive_location_filter: function( path ) {
			return ("{{DEFOLD_ARCHIVE_LOCATION_PREFIX}}" + path + "{{DEFOLD_ARCHIVE_LOCATION_SUFFIX}}");
		},
		engine_arguments: [{{#DEFOLD_ENGINE_ARGUMENTS}}"{{.}}",{{/DEFOLD_ENGINE_ARGUMENTS}}],
		custom_heap_size: {{DEFOLD_HEAP_SIZE}},
		full_screen_container: "#canvas-container",
		disable_context_menu: true
	}
As you can see the {{#DEFOLD_ENGINE_ARGUMENTS}}"{{.}}",{{/DEFOLD_ENGINE_ARGUMENTS}} will get replaced by whatever value you have in game.project HTML5 Engine Arguments field.
You should start checking your Lua code for clues. The web developer tools will not give you any real information about the code being run. Do you run a lot of code in update() functions? Also, use the profiler to learn where the engine spends most of the time.
1 Like
Thanks for the help! I put the missing bits back into my custom index.html and played around with the profiler some. I’m getting about 20 draw calls which sounds many perhaps? I have multiple gradient textures I use to fade all/parts of the screen which is probably why.
The biggest difference I found though was to uncheck High Dpi under game.project/Display. With the option unchecked, the devices that run at low FPS before run as smoothly as other devices.
That’s not much, even for html5, but on a low end device it could be a problem. Try to reduce draw calls if you can.
Makes sense. You only have to deal with 25% of the pixels with high dpi disabled.