iPhone target performance

Hello. I’ve been developing a game with Defold for a few months which I can’t wait to share, but before I do - I’m wondering if anybody has some insight into something I can’t quite figure out.

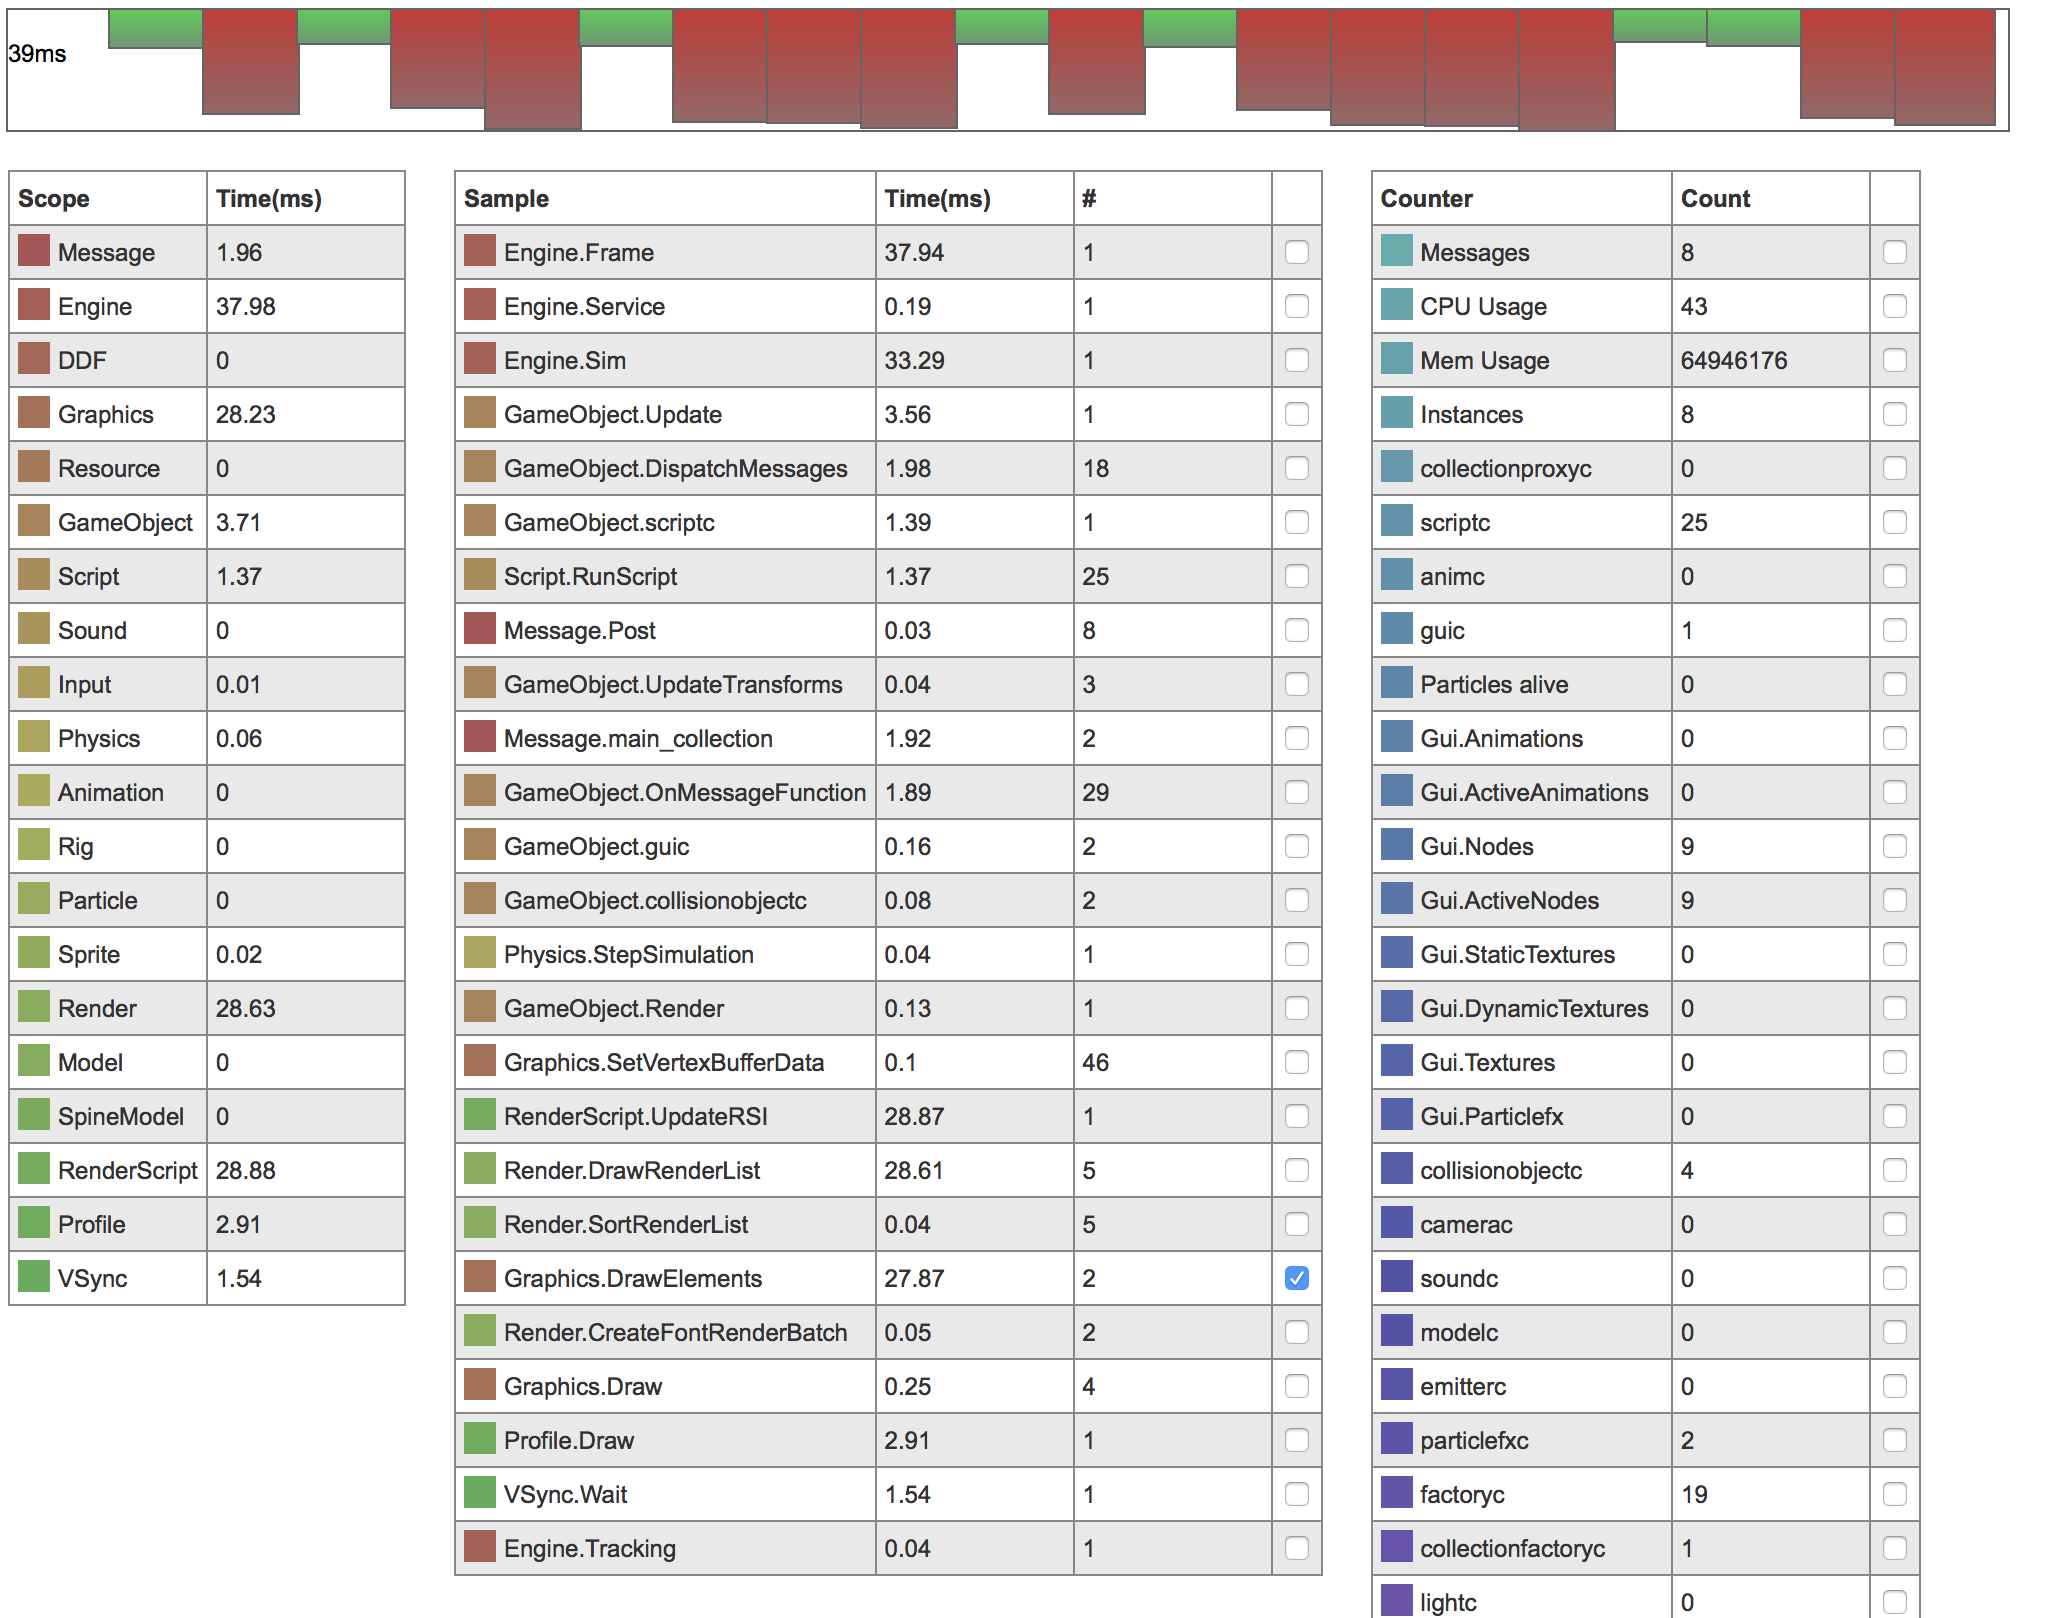
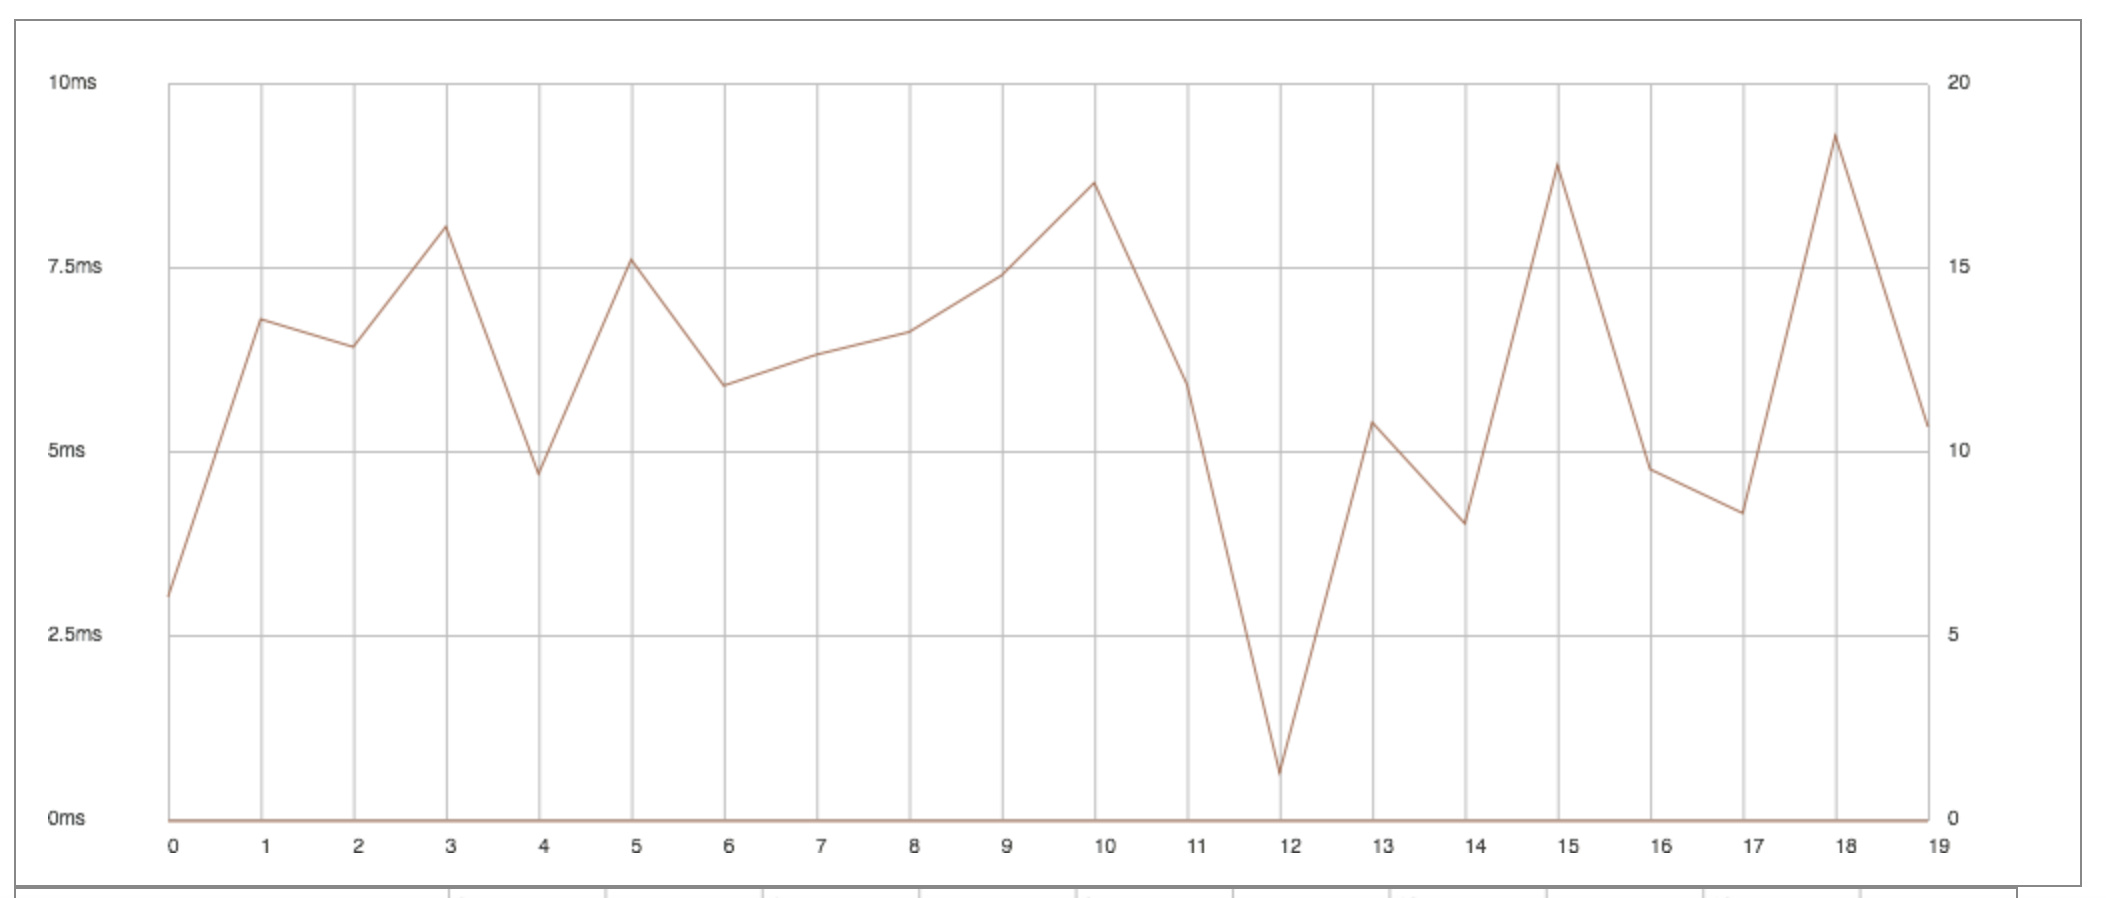
As I am approaching initial release, I have been paying more attention to optimisation of frame times in an effort to keep the game running at 60fps - and in doing so have noticed something very strange.

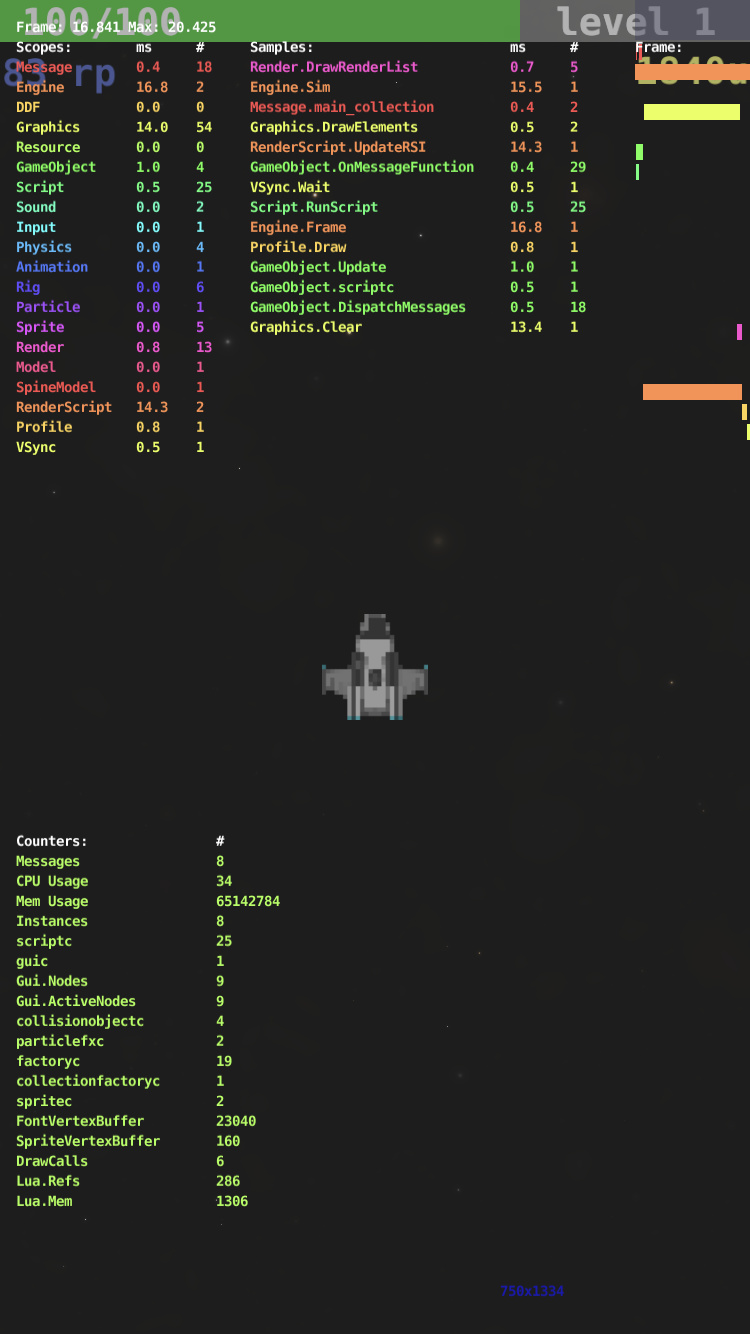
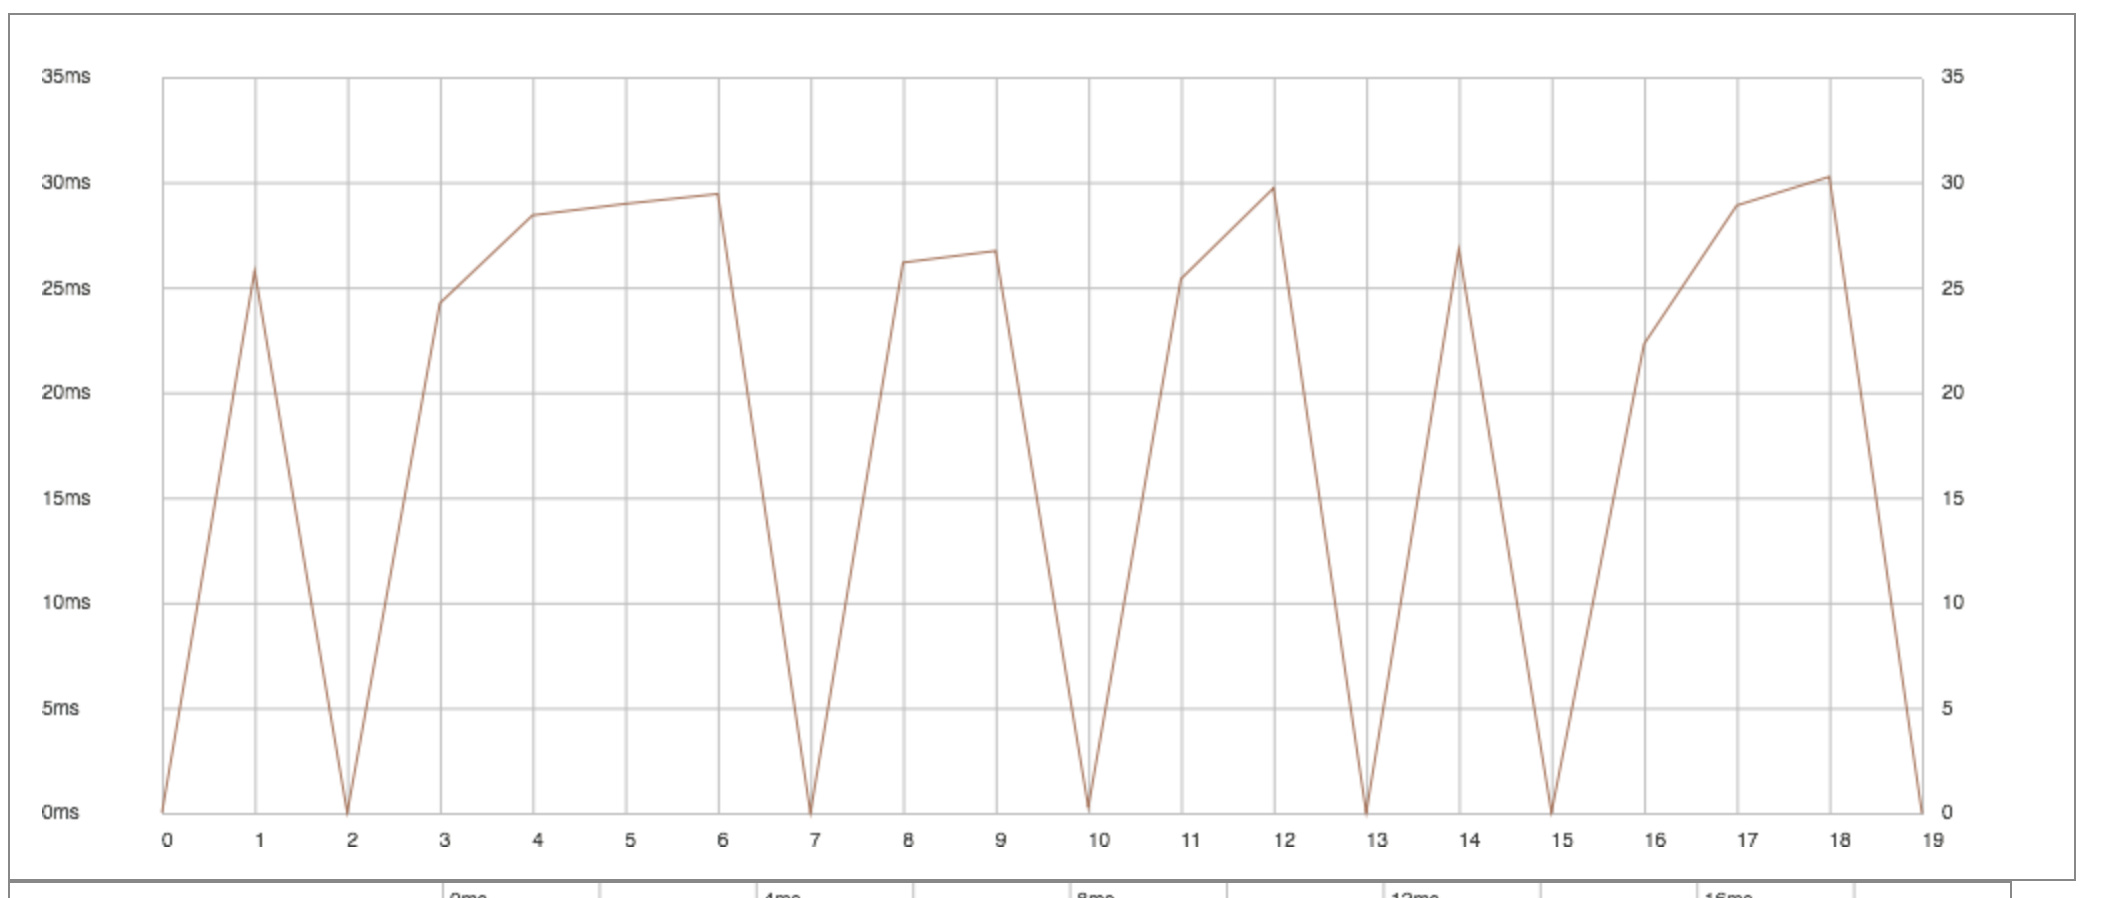
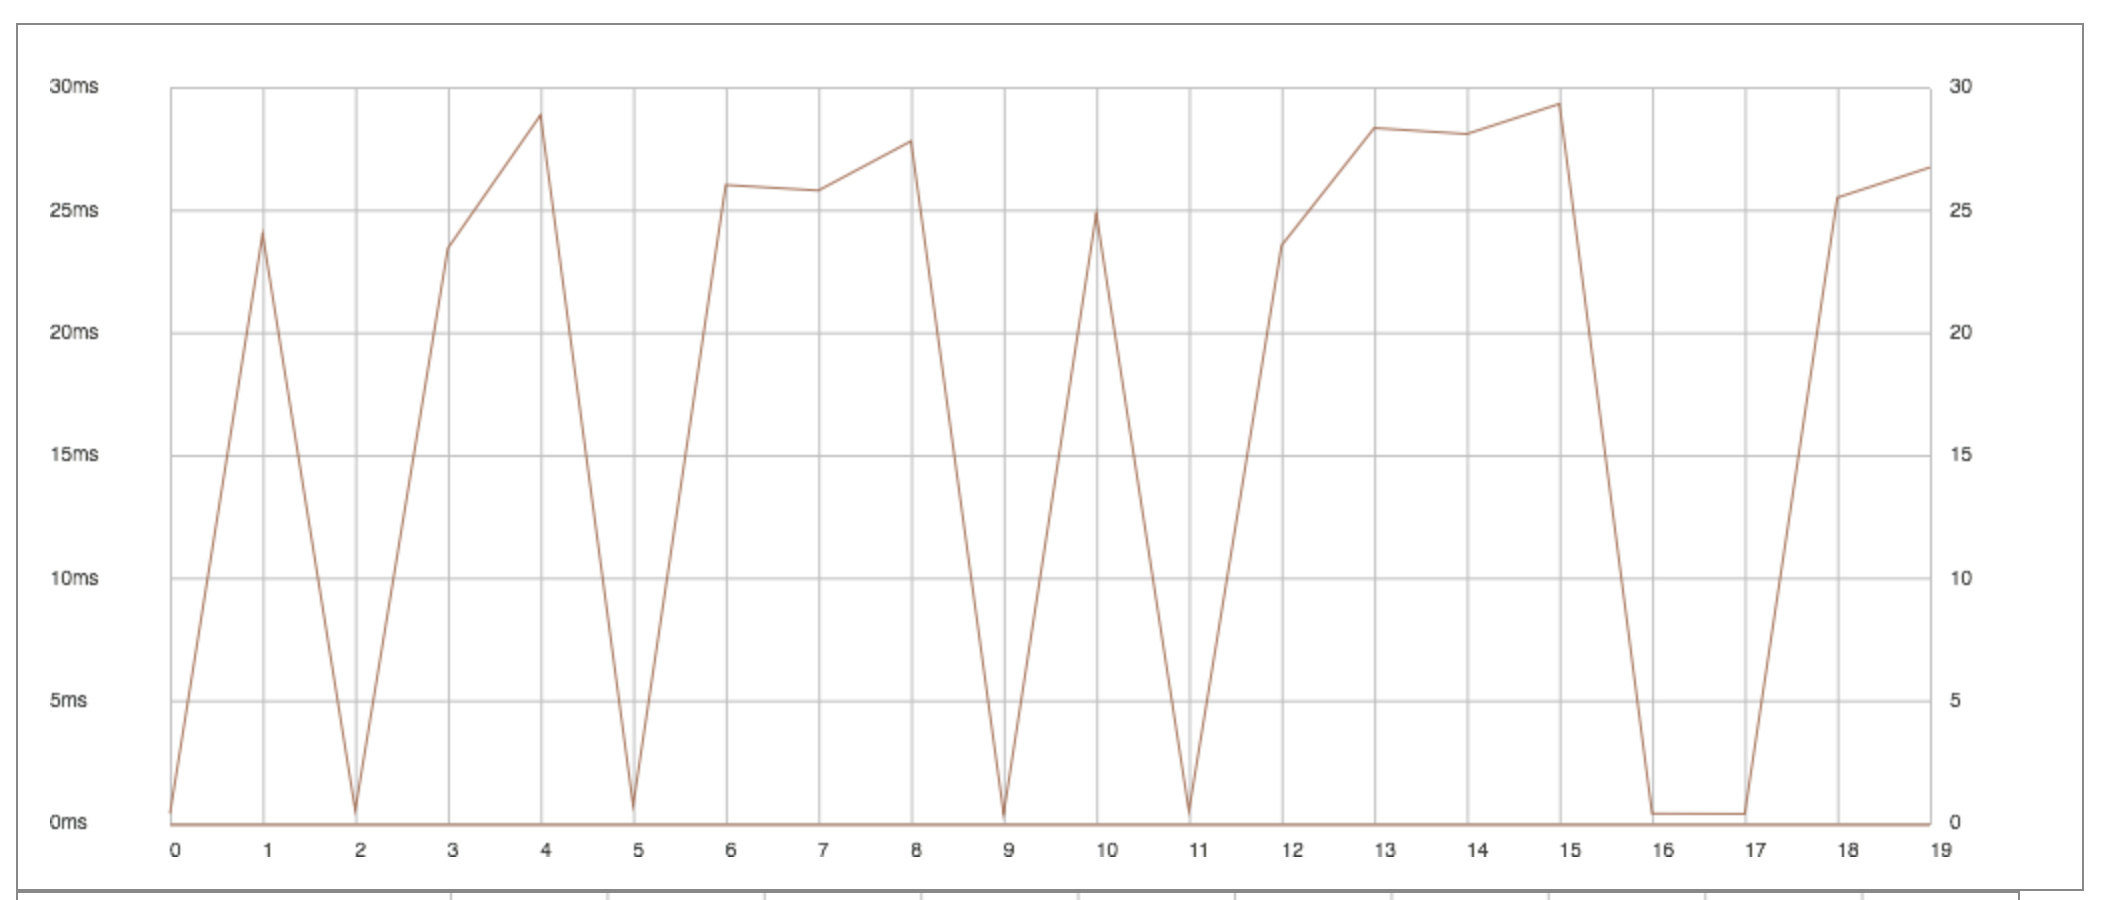
When I run the game through “Project > Bundle > iOS Application” - I get 60fps for a second or two at most) and then it settles closer to 30fps.

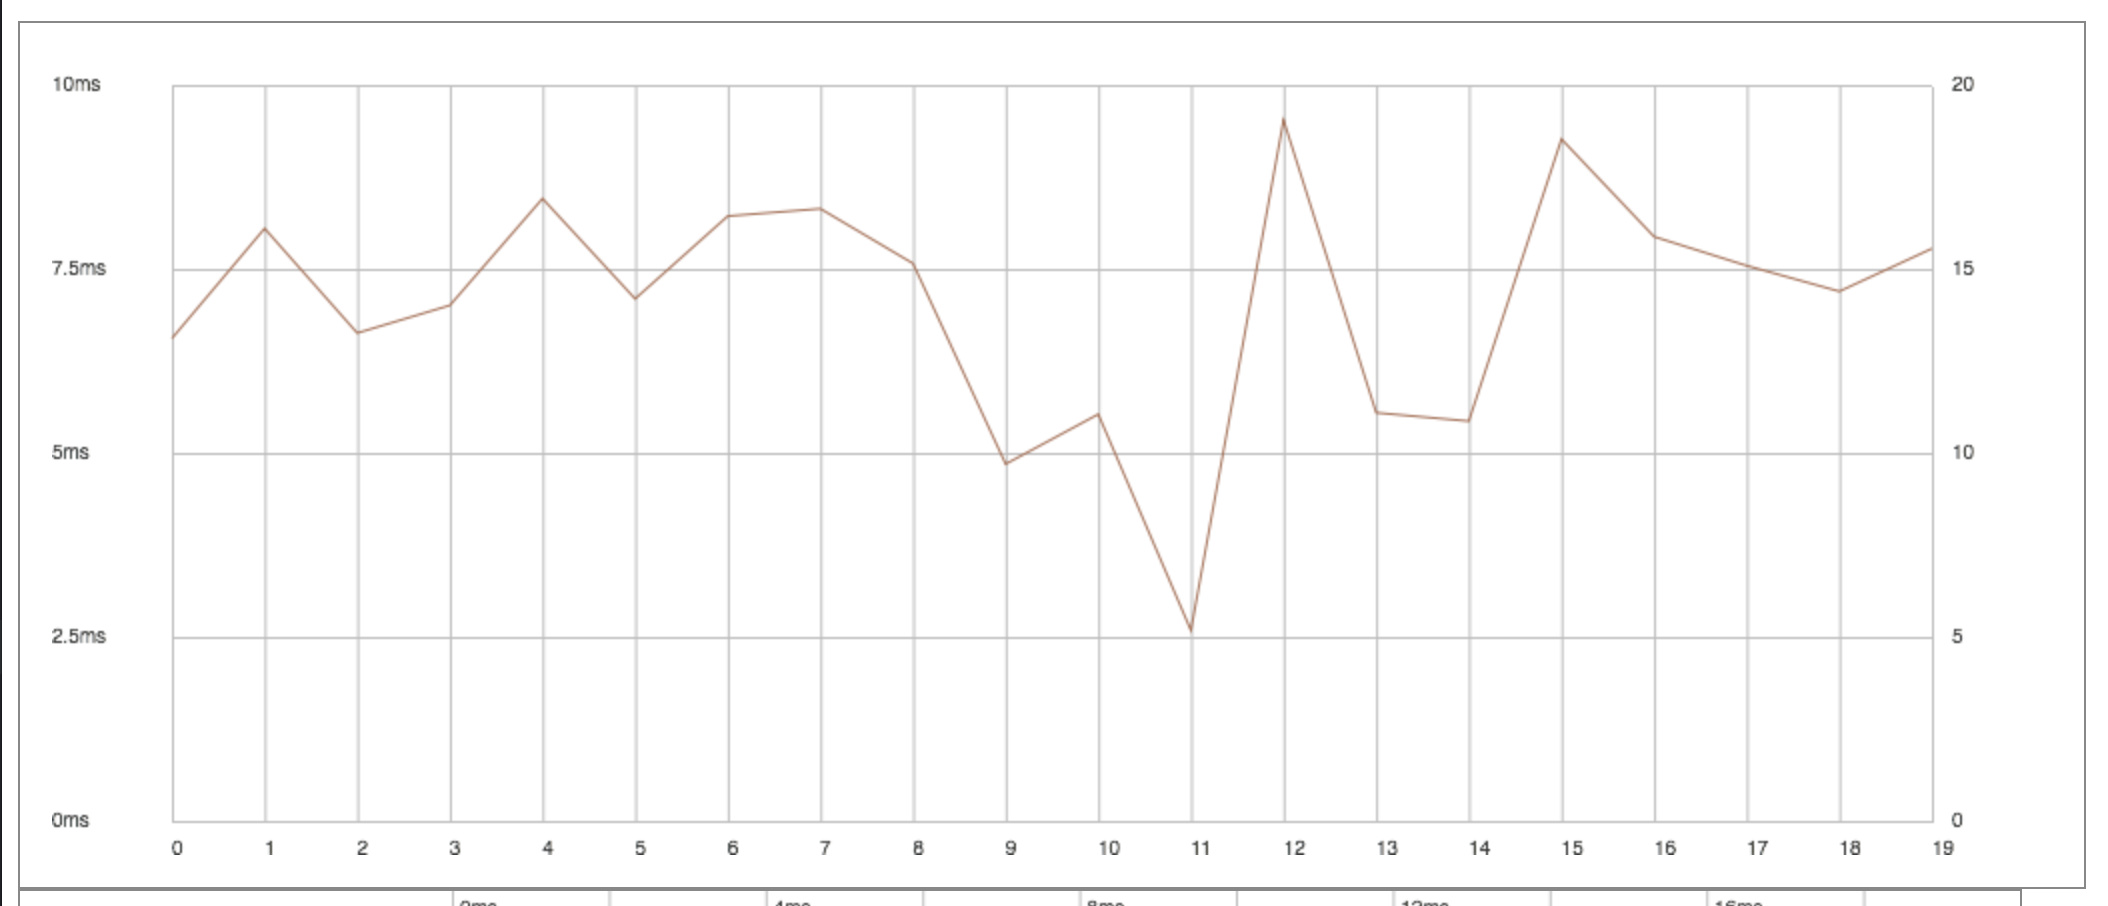
If I then run the game through “Project > Target > iPhone” and then “Project > Build” - I get a stable 60fps.

In both examples I have disabled level generation, all that is running is the player’s ship - and the background rendering shader. The background shader does seem to be the cause of my misery though, because when I remove it - I am at a constant 60fps in both scenarios.

The shader code is a modified version of the Shadertoy example:

 #define iterations 17
#define formuparam 0.53

#define volsteps 4
#define stepsize 0.3

#define zoom   20.800
#define tile   0.850
#define speed  0.010 

//#define brightness 0.0015
#define darkmatter 100.100
#define distfading 0.530
#define saturation 0.850

#define f 0.000009

varying highp vec2 var_texcoord0; 
uniform mediump vec4 position;
uniform highp vec4 parameters;

#ifdef GL_ES
precision highp float;
#endif

void main() 
{
	
	vec2 res = vec2(1, 1); 
	vec2 uv = var_texcoord0.xy * res.xy - 0.5;	
	vec3 dir = vec3(uv * zoom, 1.0);	
	
	float brightness = parameters.x;					
		
	float a1=.5;
	float a2=.8;
	mat2 rot1=mat2(cos(a1),sin(a1),-sin(a1),cos(a1));
	mat2 rot2=mat2(cos(a2),sin(a2),-sin(a2),cos(a2));
	dir.xz*=rot1;
	dir.xy*=rot2;
	vec3 from = vec3(0.0,0.0,0.0);
	
	from+=vec3(position.xy*f,1.);
	from.xz*=rot1;
	from.xy*=rot2;	

	//volumetric rendering
	float s=0.1,fade=1.;
	vec3 v=vec3(0.);
	for (int r=0; r<volsteps; r++) {
		vec3 p=from+s*dir*.5;
		p = abs(vec3(tile)-mod(p,vec3(tile*2.))); // tiling fold
		float pa,a=pa=0.;
		for (int i=0; i<iterations; i++) { 
			p=abs(p)/dot(p,p)-formuparam; // the magic formula
			a+=abs(length(p)-pa); // absolute sum of average change
			pa=length(p);
		}
		float dm=max(0.,darkmatter-a*a*.001); //dark matter
		a*=a*a; // add contrast
		if (r>6) fade*=1.-dm; // dark matter, don't render near
//		v+=vec3(dm,dm*.5,0.);
		v+=fade;
		v+=vec3(s,s*s,s*s*s*s)*a*brightness*fade; // coloring based on distance
		fade*=distfading; // distance fading
		s+=stepsize;
	}
	v=mix(vec3(length(v)),v,saturation); //color adjust
	gl_FragColor = vec4(v*.01,.2);	
}

The actual resolution you get is depending on the splash image size. You can try to print (or debug-draw text) the actual resolution in both cases with render.get_window_height() and render.get_window_width().

I suspect that you have higher resolution in the bundled game putting stress on the background fragment shader.

2 Likes

Unfortunately this doesn’t seem to be the case.

In both cases the resolution is reported as 750x1334 using:

local t = render.get_window_width().."x"..render.get_window_height()
msg.post("@render:", "draw_text", {text = t , position = vmath.vector3(500, 50, 0)})

Bundled:

Target:

I deleted my previous post because I reported the resolution incorrectly… whoops :slight_smile:

Edit: Interestingly, side by side there does seem to be a difference in the resolution of the background - noticeable by the level of detail (this could also be the brightness property which may have been different)

The images show a huge difference in Graphics.Clear, but that is only one frame. Do you see this difference over time in the web profiler as well?

Yes, I had noticed this.

In both screenshots I have selected the most offending frame from the sample:

Bundled:

Target:

Graphics.clear over time:

Bundled:

Target:

Interesting.

Summoning the wizards… @sven and @Mathias_Westerdahl and @Johan_Beck-Noren. Any ideas what is going on here?

3 Likes

I am blessed :slight_smile:

Thanks, I hope we can figure it out :slight_smile:

If you are using a custom render script you can try removing the call to render.clear temporarily and see if that speeds things up. Odds are the problem is somewhere else and just manifests itself in the call to render.clear, but maybe we can see the time spent moved to somewhere else in the profiler.

Sure, with the render.clear() call removed, Graphics.DrawElements now seems to be the offender.

Bundled:

Target:

Are you using editor 1 or editor 2 by the way?

What if you scale down iterations in increments in the shader, is there a sweet spot where you get higher frame rate when bundling?

1 Like

I am using editor 2.

I will try incrementally reducing the iterations in the shader if nothing else works. But since I know it’s capable of running ~60fps through the target build it feels like a trade-off I shouldn’t need to make - it feels like it should be a last resort.

I won’t be able to respond or try anything until tomorrow now, but thanks for your help so far. Hopefully tomorrow I will have further information.

4 Likes

Yes of course, it’s just a matter of zeroing in the cause :slight_smile:

4 Likes

I tried a project with the shadertoy shader on an iphone but was unable to reproduce the behaviour here. Would you mind sharing your project with me? What model iPhone are you testing on?

2 Likes

In an effort to narrow down the cause I have cloned my project and an systematically removing things to find potential offending code. Once I have done this I will zip up the project and post it here, hopefully won’t be too long. Again, thanks for your help :slight_smile:

Oh, by the way, I am using the render cam render script and camera library too, maybe this is part of the problem. https://github.com/rgrams/rendercam

Edit: I’m using an iPhone 7 and my friend was able to reproduce it on an 8 too.

3 Likes

I deleted lots of stuff from the game to narrow down the problem and thankfully (or not…) can now reproduce the issue clearly with just the background, the player ship, and all other game systems removed.

I have tweaked the shader in a way that seems to demonstrate the disparity in frame time between bundled builds and target builds. It seems that when there is more bright areas of the background present on the screen, performance tanks on the bundled version, and mildly dips on the target version.

game.zip (5.0 MB)

2 Likes

Cool, I can have a look in the morning.

1 Like

I tried this on an iPhone here at the office. In both bundled and targeted runs I get frame times jumping between ~16ms and ~33ms over time. This indicates that the time for a frame is around, and sometimes over, 16ms which causes the iPhones vsync to sometimes snap up to 33ms.

I can’t see any difference in performance between running the app as a bundle or targeting a device through the editor. I’ll try a few different iPhones and see if anything else turns up.

2 Likes

OK. Are you bundling first, and then using that bundle as the target? That’s what I was doing (and I didn’t even know this was possible). I will continue to figure out a pattern and report here if I find one - because I am definitely seeing a difference.

Thanks for your time :slight_smile:

3 Likes