Is there any documentation on how to interpret the visual profiler output?
My Android builds are experiencing intermittent but severe slowdown (maybe 25% speed) and I’m looking for clues. It seems strange that the game starts perfectly fine but after a minute slows right down then a few seconds later speeds back up again.
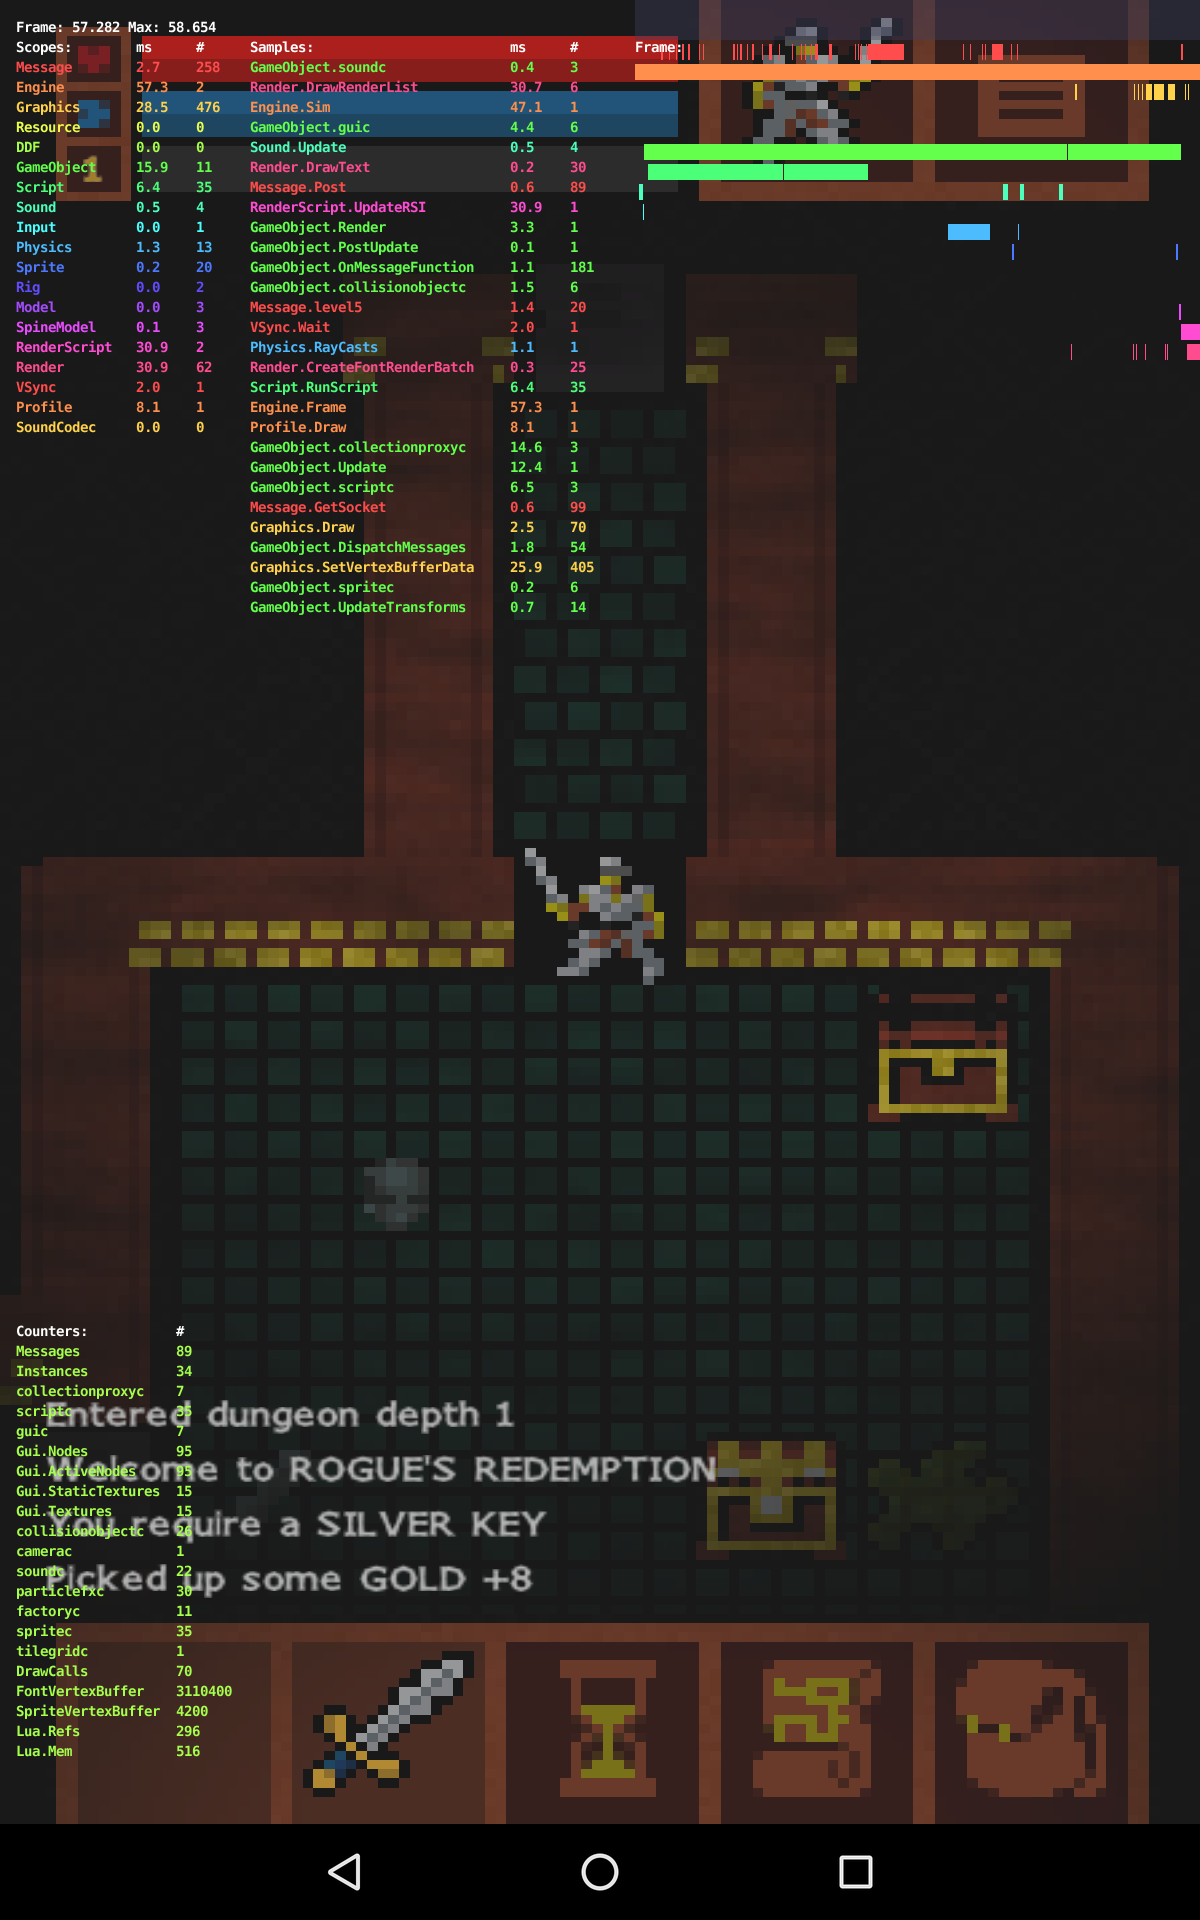
It might be that you create a lot of garbage that needs to be collected during the slowdown. Either way, the profiler shows various scopes and how much time is spent in them (milliseconds and # of calls). The bars on the right are color coded to correspond to scope colors. At the bottom you have resource counters.
The web profiler is easier to work with since it allows you to sample data at any point and study that data without interruption. In your case you can wait for a slowdown, sample data and then check what takes time.