Right now the builtin profiler is handy - but sometimes it is ‘buggy’ (in lack of a better word).
I think it could use some tuning!
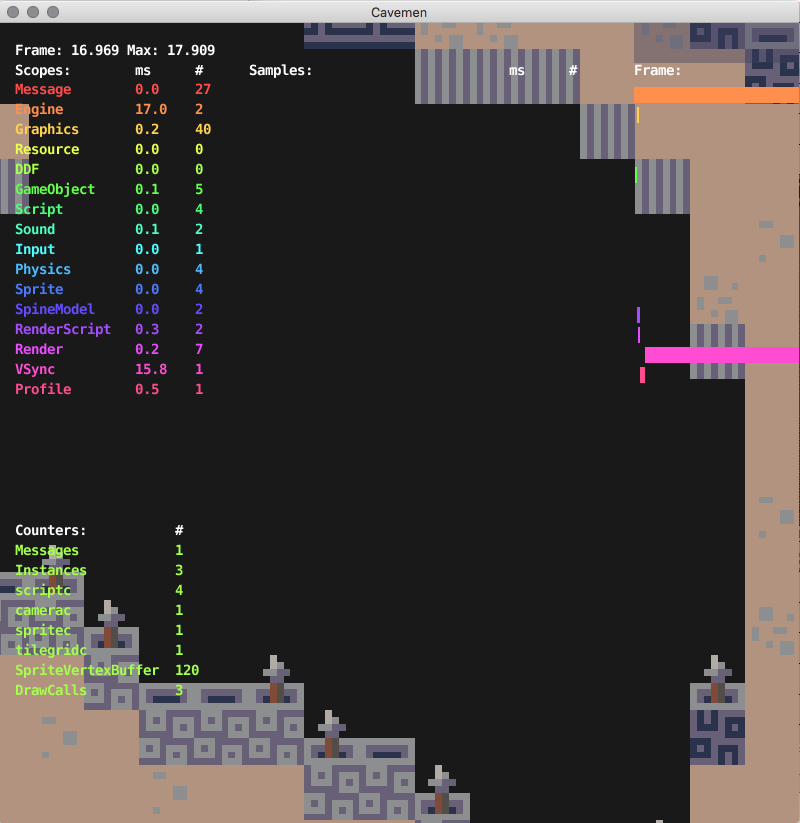
To start with the middle “Samples:” list is barely readable as of now with all the jumping, maybe this could be improved in some kind of way. Like items don’t get removed or something.
The “Counters:” list is for me one of the most helpful but unfortunately sometimes some items falls out (draw calls for instance) if there a lot of stuff being “counted”. Maybe this list could be moved up a bit? or being filled up bottom and up instead of standard top to bottom.
In addition it would also be helpful to see how much memory the textures uses and how many there are in memory.
And a counter for how many particles there is in the scene (or have maybe the counter have disappeared?)