How to get more verbose info when debugging lua

Hello all,

I have a simple script that opens a GUI (from an internet tutorial), but somehow the GUI doesn’t appear. I suspect I did something wrong. My problem is that I can’t find any hints or error messages in the Defold editor about what might be wrong. Even when I start the debugger, it passes the msg.post function, but the GUI still isn’t presented.

My end goal is to do less guessing and get more verbose debug messages. :
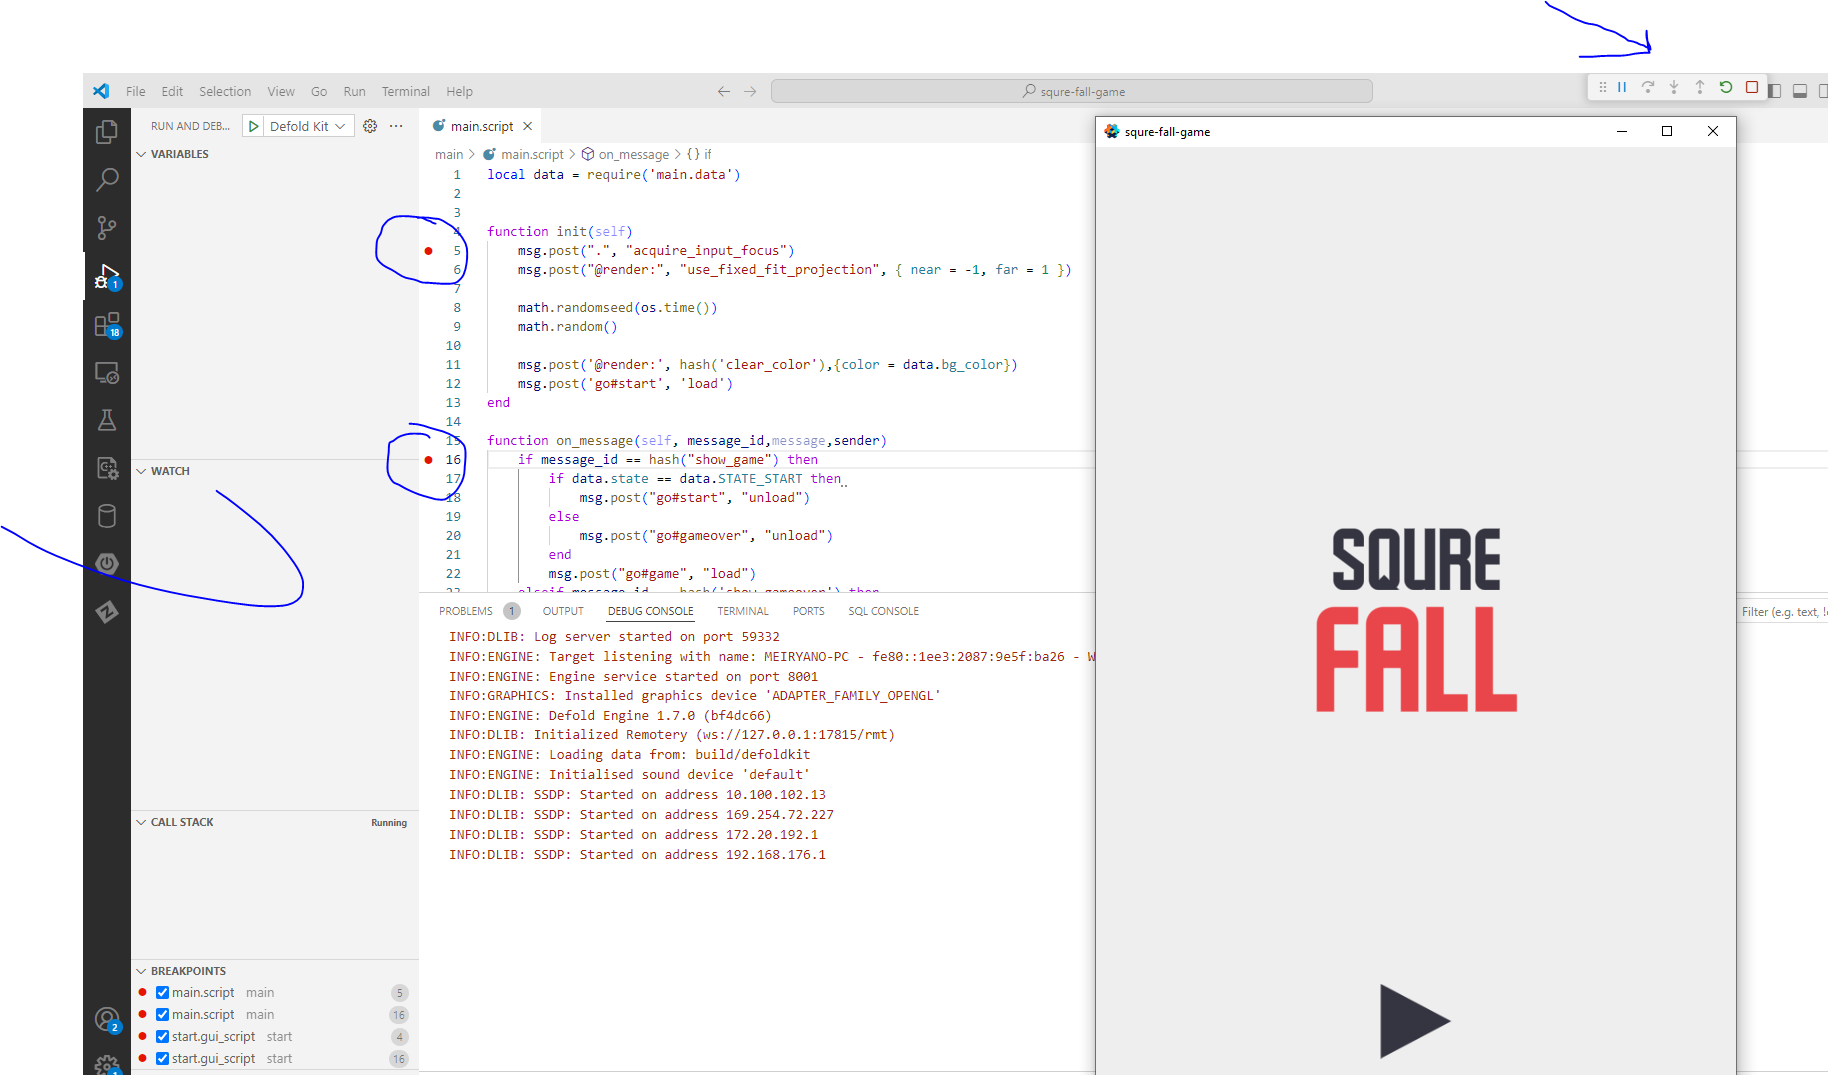
i have this code

    local data = require('main.data')


    function init(self)
    	msg.post(".", "acquire_input_focus")
    	msg.post("@render:", "use_fixed_fit_projection", { near = -1, far = 1 })

    	math.randomseed(os.time())
    	math.random()

    	msg.post('@render:', hash('clear_color'),{color = data.bg_color})
    	msg.post('go#start', 'load')
    end

    function on_message(self, message_id,message,sender)
    	if message_id == hash("show_game") then
    		if data.state == data.STATE_START then 
    			msg.post("go#start", "unload")
    		else
    			msg.post("go#gameover", "unload")
    		end
    		msg.post("go#game", "load")
    	elseif massage_id == hash('show_gameover') then
    		msg.post("go#game", "unload")
    		msg.post("go#gameover", "load")
    	elseif massage_id == hash('proxy_loaded') then 
    		msg.post(sender, 'enable')
    	end
    end

the msg.post(‘go#start’, ‘load’) is fire but never get ( i guess to )
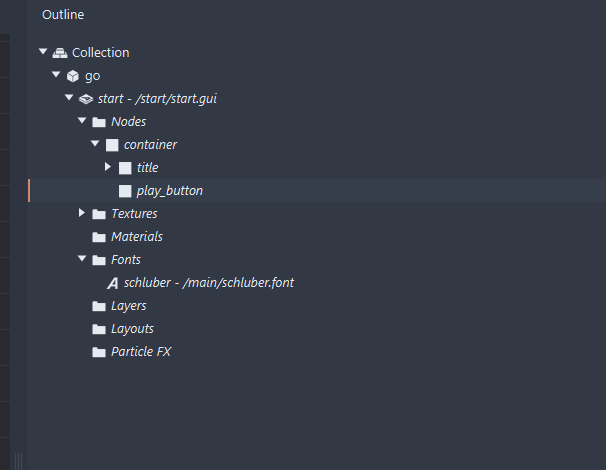
never gets to here :
image
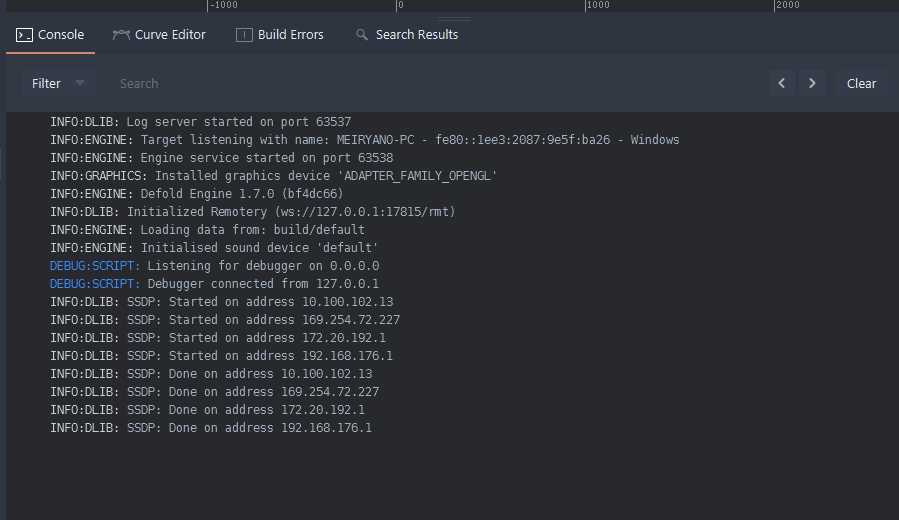
but i can’t know as all i see in the console is this :

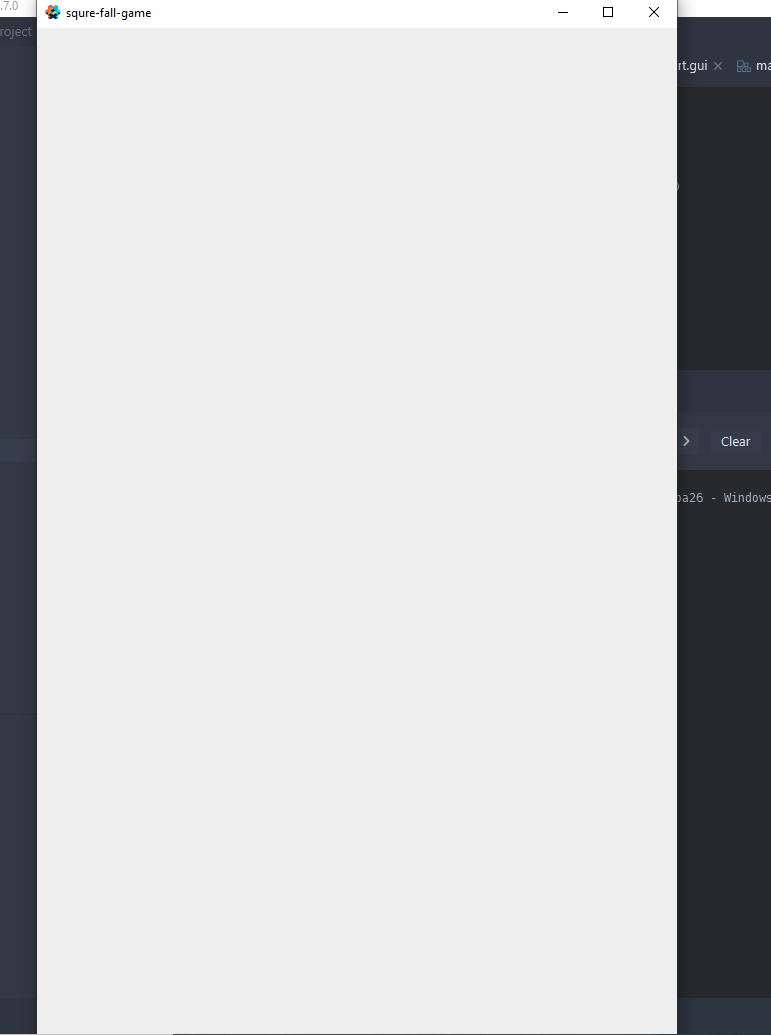
and im getting blank window

so how to get more verbose info ?

This should be message_id :slight_smile:

One thing you could have done to detect this was to add a breakpoint to your on_message function and wait for the proxy_loaded message. The GUI will not show until you call msg.post(sender, 'enable'). You would then have noticed that you didn’t enter the proxy_loaded check.

You have some options:

  • Install the Lua Language Server to do automatic static code analysis. Instructions in this manual: Writing code
    • This should catch things such as use of unknown globals such as massage_id
  • Use VS Code with the VS Code Defold Kit. Instructions here: Writing code
    • The VS Code plugin gives you the same kind of static code analysis as above.
2 Likes

switched to vs code . this is other world ! tnx

UPDATE .
After switching to Visual Studio, I noticed in the lint that there was a syntax problem. However, now when I try to set breakpoints and debug, the breakpoints never get triggered. It seems like everything is configured correctly, and the debugger is running.

in the picture you can see im starting the debugger but break pont dont stop

Version: 1.88.0 (user setup)
Commit: 5c3e652f63e798a5ac2f31ffd0d863669328dc4c
Date: 2024-04-03T13:26:18.741Z
Electron: 28.2.8
ElectronBuildId: 27744544
Chromium: 120.0.6099.291
Node.js: 18.18.2
V8: 12.0.267.19-electron.0
OS: Windows_NT x64 10.0.19045

Do you have these lines at the start of your script?

local debugger = require('debugger.debugger')
debugger.start()

When you initialize Defold Kit in your project, the folder “debugger” with the above module should have been added.

1 Like

yes found it was about to post it
now its working