We’ve just shipped the first version of an in-editor debugger for editor 2, available in the latest update!
This is the initial release of a quite big piece of functionality, and while there are lots of things we still want to do with it, we believe that it is now in a state that can provide a lot of value and benefit from more real-world usage.
As always, we are really interested in and appreciative of your feedback, so if you give it a go and find issues or have feature requests, please report them as usual on editor2-issues.
Some features:
One-click, zero-config “Run project with debugger”
Supports attaching to and debugging remote target on device
Inspect call stack
Inspect variables, including diving into tables
Evaluate arbitrary lua code at breakpoint
10 second crash-course:
To run your project with the debugger: select “Debug > Start with Debugger” (or F5)
To place a breakpoint: Click to the right of the line number in the code editor gutter (or F9).
I just tried this and I had trouble finding how to add a breakpoint without coming here to the forums. The reason is that the documentation isn’t updated (Debugging in Defold) and to me it was confusing that “Toggle breakpoint” is in the Edit menu and not in the Debug menu like all the other debug options.
Also, both Step Into and Step Out displays the same hotkey for me “fn F11” (Mac OS), but in reality I only have to press F11, since I have the “Use F1..F12 as regular function keys” or what ever the translation of that Mac OS keyboard option is.
Thanks for pointing this out. This is on my list of things to fix. The whole documentation is going through a major overhaul now that we are switching to editor 2. PR:s are welcome.
hello Ragnar,
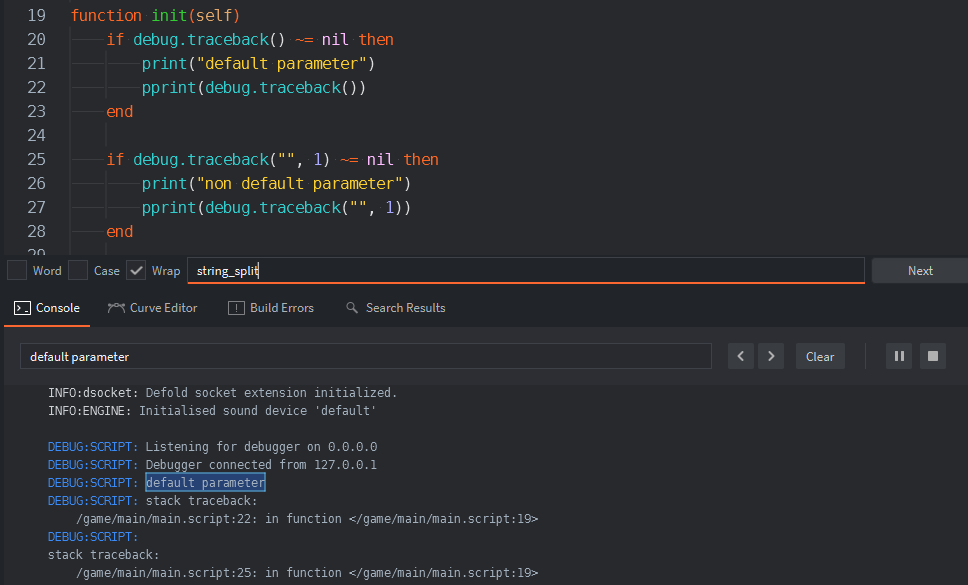
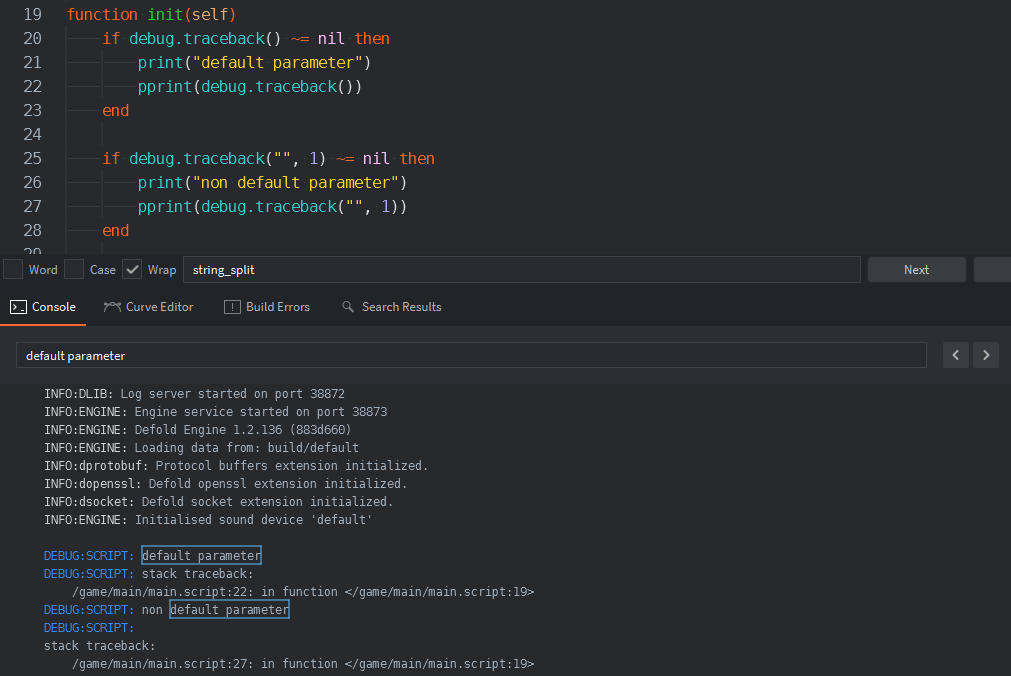
I had met a small issue in the debugging model in editor2. I’m not sure if it is an editor or engine issue. You may take a look at the details.
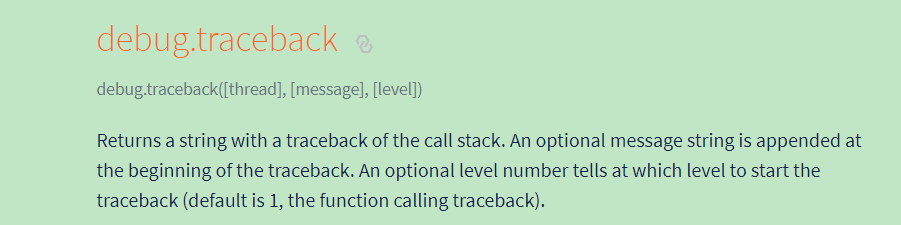
The debug.traceback with parameter will return a nil in the debugging model in the editor2. But the default paramter(non parameter from user) does work correctly. When directly run the game without debugger, then the debug.traceback with parameter does work correctly.
According to the console result with script line number, it looks like the non parameter call directly print the result on the console instead of returning the string in debugging model in the editor2.