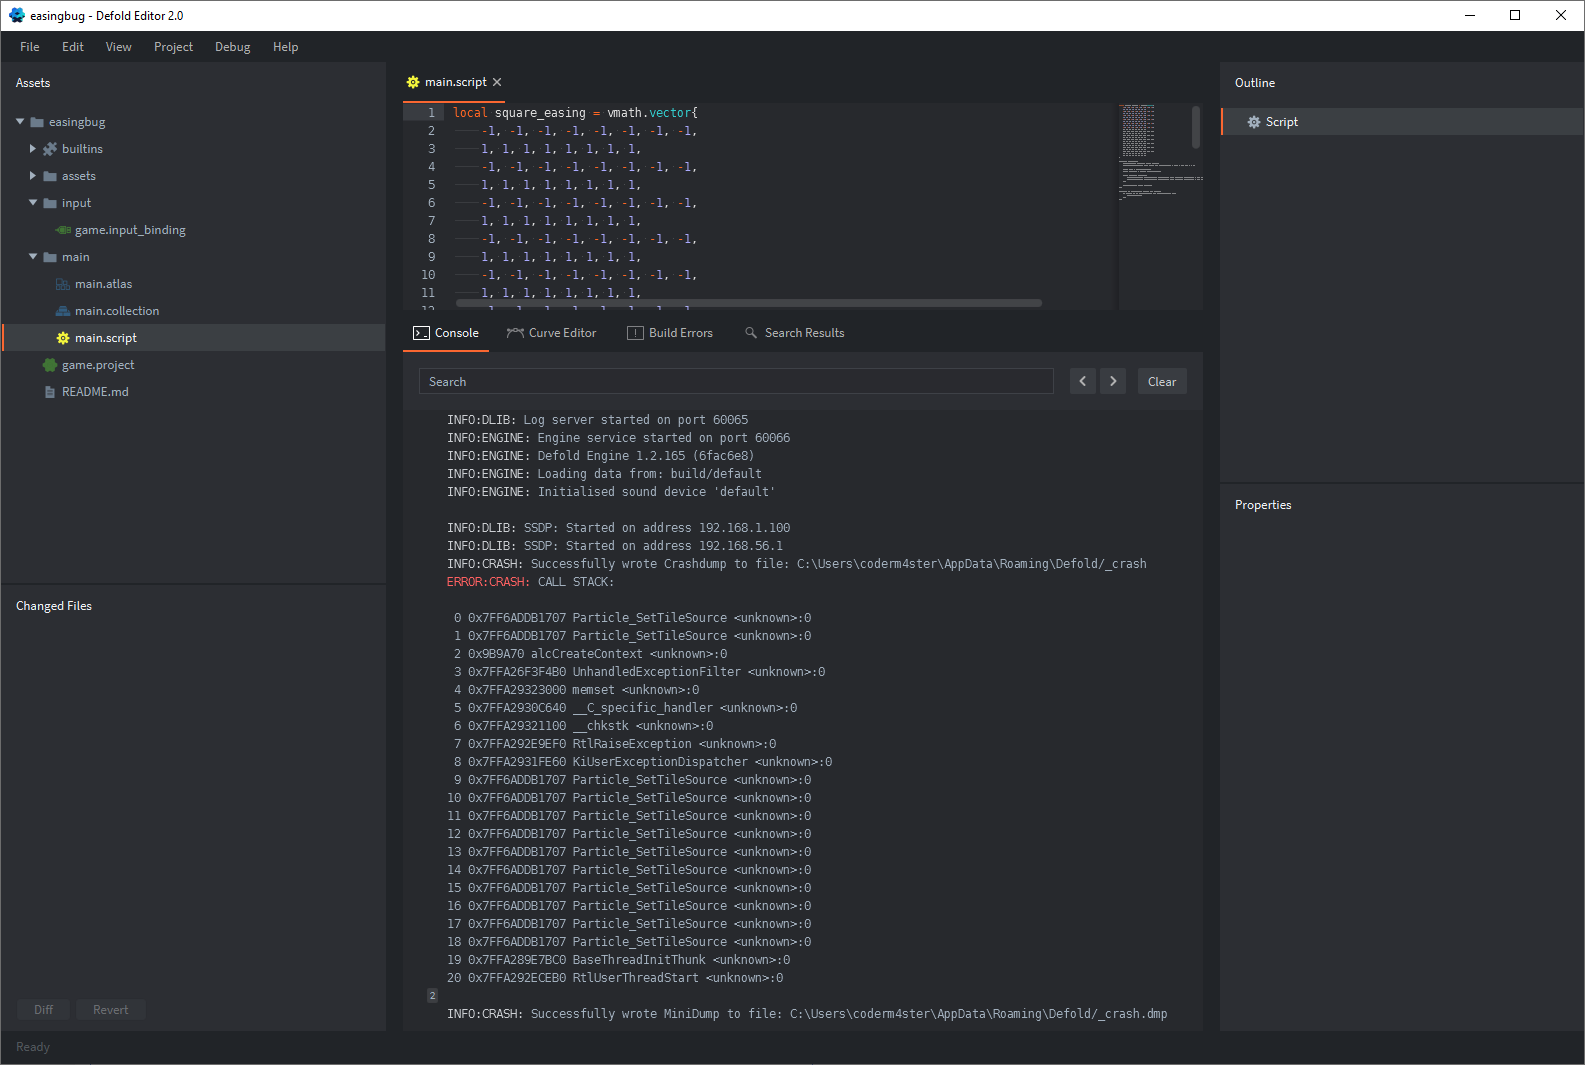
Are you sure? The example shared by @sergey.lerg does not use any particle effects and the crash log you shared clearly shows that it is a crash with particle effects.
It’s possible, but in this case, I should see the original error that @sergey.lerg showed, didn’t it?
However, as I see it, he did not copy the error from the editor.
Yes this is true, but basically I should see the same call stack on all systems when viewed in the same context. Can I ask you from what environment did you copy the error?
Call stack is generated when the corrupted memory is used, not when it’s generated, so that can be two completely different places.
It’s from macOS crash report dialog.
Thanks! I’m assuming you’re using a dmengine that contains debug symbols, and I’m using a built-in that doesn’t contain debug symbols and that’s why we see different call stacks. I’ll try something…
If I run this and select this as the target in the editor, I will see the same as you. Obviously this release contains debug symbols. You might also want to enable this in a runtime environment launched by the editor.
All our builds have debug information built into them.
The only time it gets stripped is when you do bundling (and only for some platforms)
There are several issue with creating a good callstack: Non corrupt memory, Jit’ed code, longjumps etc.
So there are multiple ways it can go wrong to produce a callstack, and you’re not always guaratueed to get a similar callstack as another user.
Yes, many circumstances can affect the content of a call stack. The key here is the last statement before the untreated exception, indicated by the following line:
I think this line (or something similar) should appear on every system and I missed it on my first screenshot. Why, in this case, the particle line appears in the call stack. I figured out the solution.
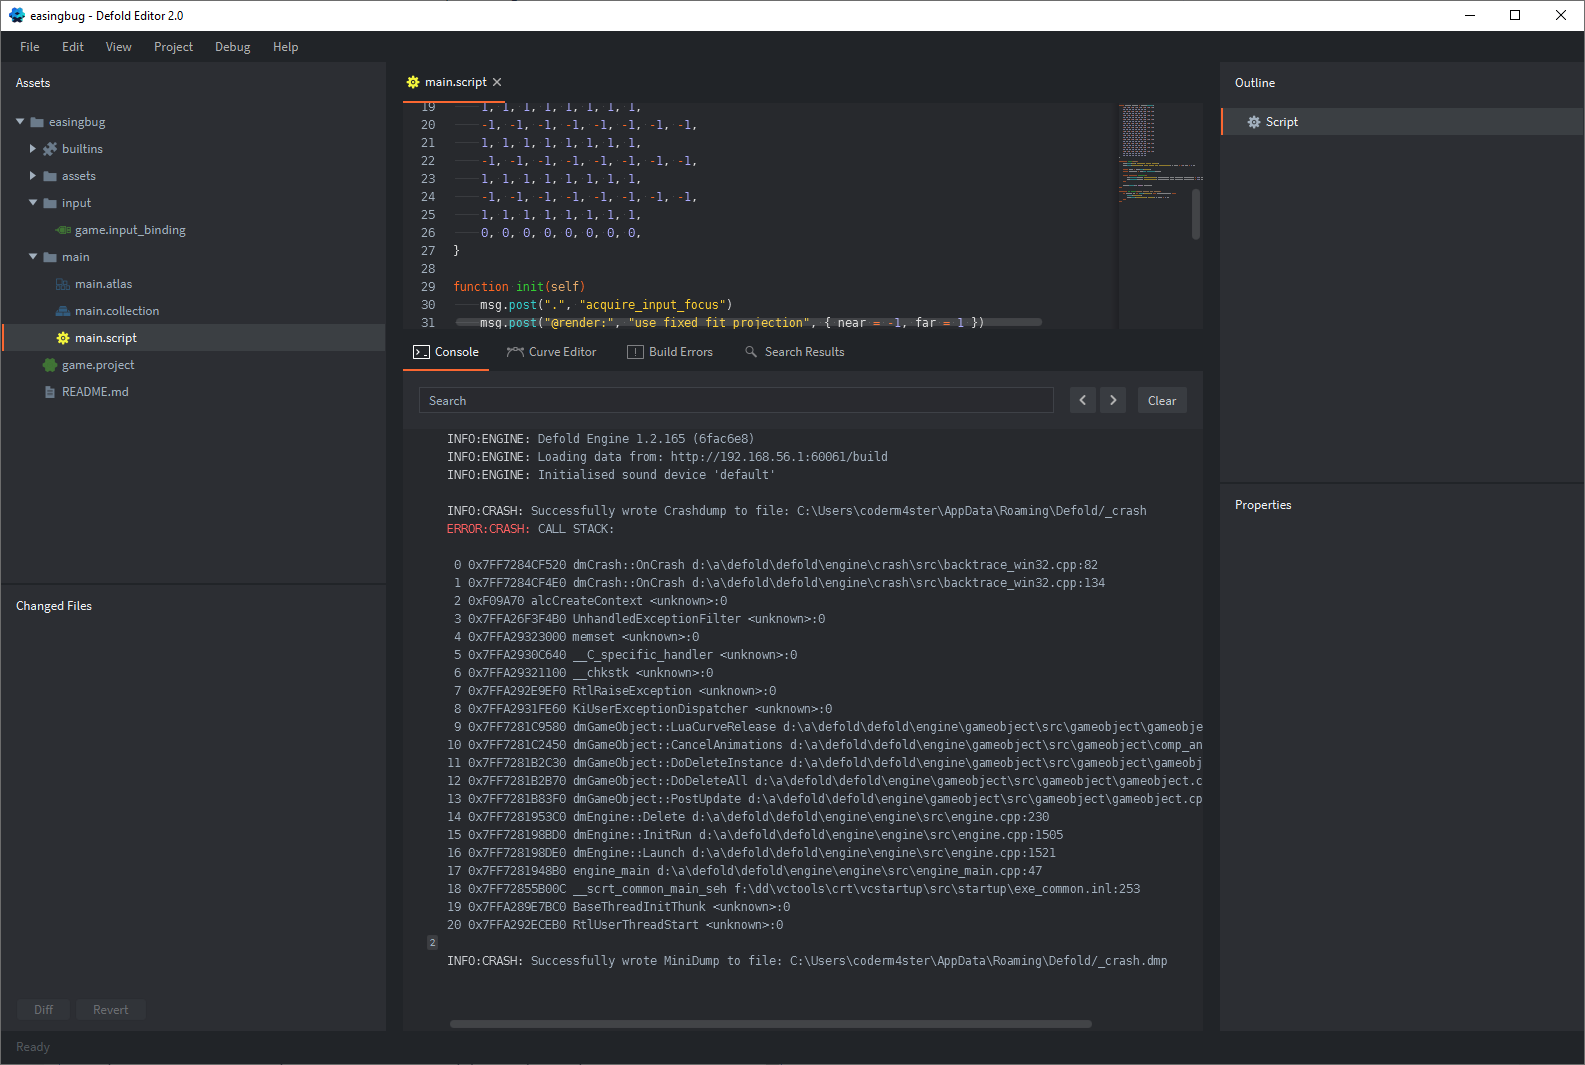
I binary compared the downloaded dmengine.exe to the built-in (uncompressed) version and they are completely the same. However, when I ran the two dmengines separately, different call stack contents were created but they were each consistent. At first I didn’t understand the difference but I noticed that besides the downloaded dmengine.exe I also downloaded dmengine.pdb. So if I run dmengine.exe with dmengine.pdb in the same directory, it will print the line above in the call stack, otherwise it will not.
I thought if I copied dmengine.pdb to the directory containing the built-in dmengine.exe and running it from the editor would be fine, but not. For some reason, it can’t find pdb, but if I run it as a standalone then it’s fine.
Sorry for the lengthy posts, I just like to see clearly