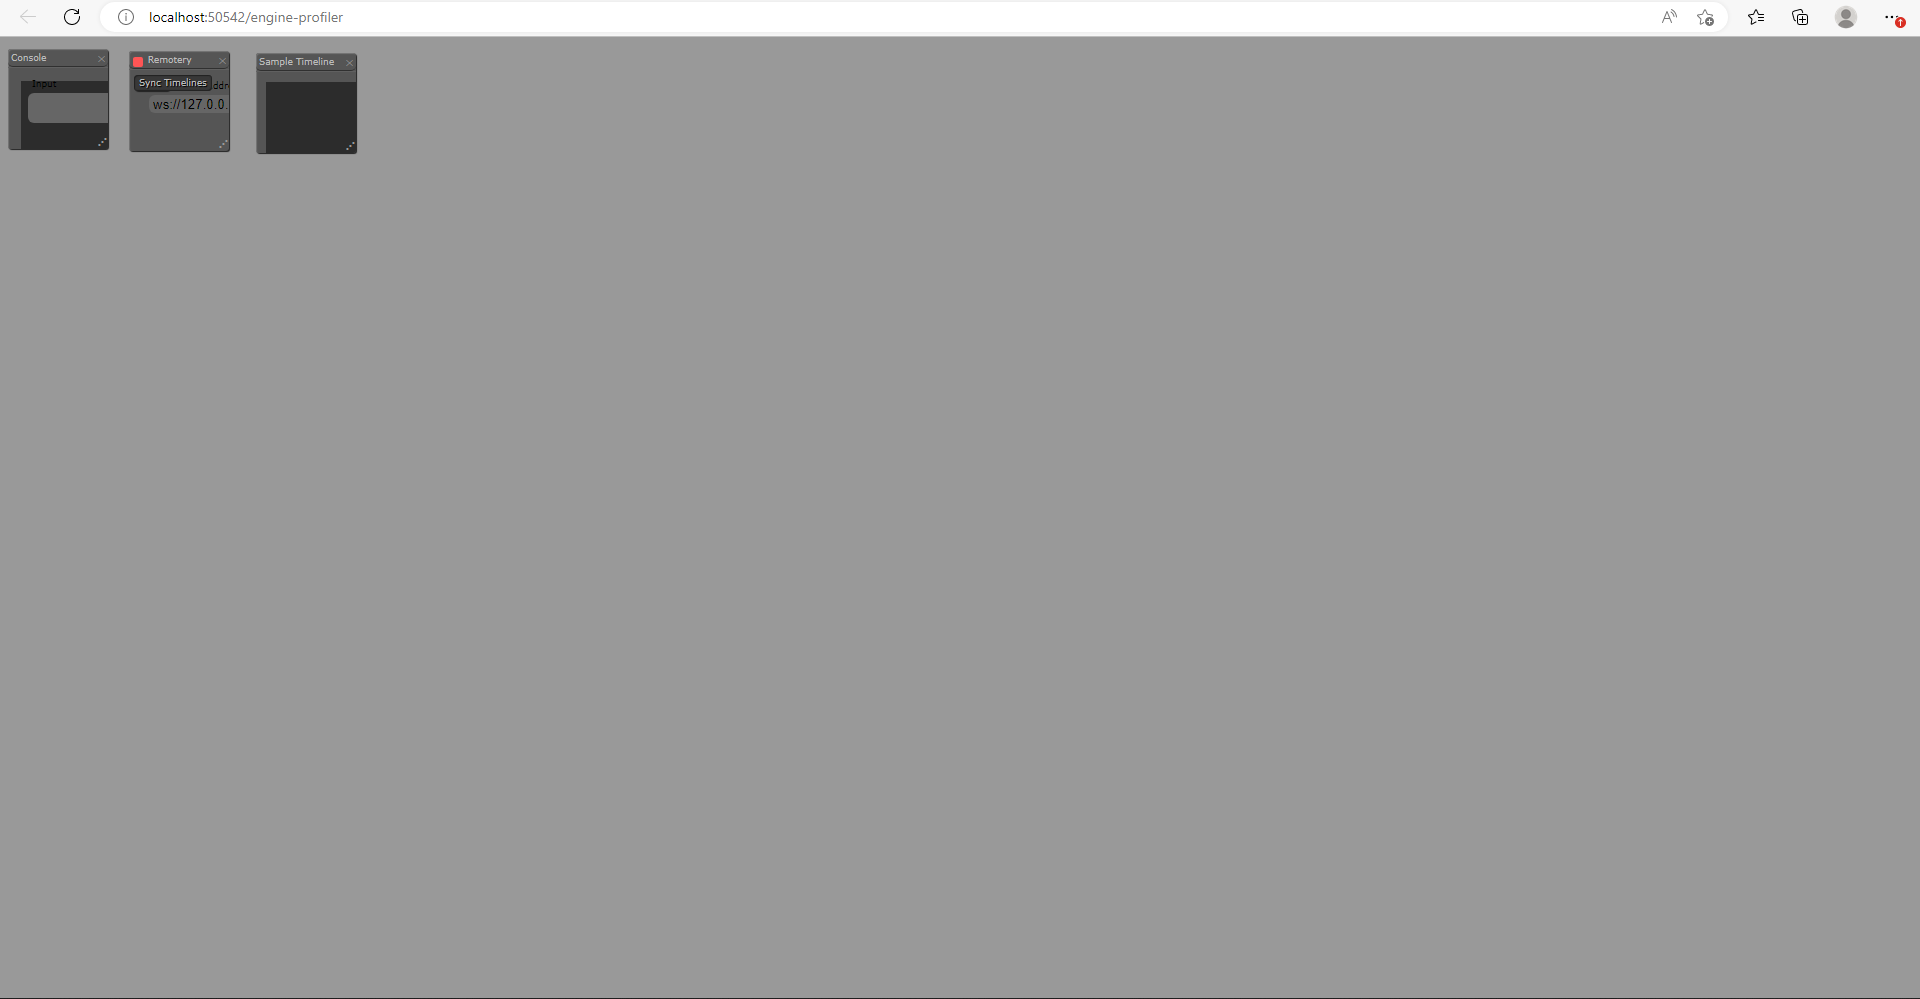
I tried looking at another post and their profiler seems to work but going to debug → web profiler just shows this.
I want to see what the CPU is working on since lately even empty projects have been taking up a lot of CPU usage, so is there a way to fix this without having to downgrade?
1 Like
britzl
July 17, 2022, 6:06am
2
Can you please check if you have any errors in the developer console in the browser? Which browser are you using? Is that Edge?
Ok weird, I just opened it and it’s working. I’ll report back if it stops.
It stopped working again, here’s the error:
WebSocketConnection.js:57
WebSocket connection to 'ws://127.0.0.1:17815/rmt' failed: Error in connection establishment: net::ERR_CONNECTION_REFUSED
Edit: It seems that it works sometimes and other times it doesn’t.
britzl
July 18, 2022, 5:27am
5
We’re looking into the reported issues with the profiler and hope to have a fix available soon.