With GUI component too?
Yes, I’ve tested with GUI component too.
It all works as expected.
As a side-note, the engine is continuously built and tested with extensive unit-tests for all platforms. It is also tested through valgrind on the Linux builder. No tests are 100% of course, but we do our best to be thorough. It’s a proven point the time spent writing thorough tests pays back in the long run.
In any case we can’t test what is happening within the Open GL driver itself.
You can rest assured the texture(s) are getting correctly deleted in the engine.
What the Open GL driver does under the hood is nothing we can or should control.
4 Likes
Thank you for your explanations!
Now everything is clearer! 
Unfortunately I tried to use OpenGL Profiler but it’s show nothing in “Resources” window. But if you told that everything works fine - ok. It’s sad that engine has no simple possibility to check which and how many textures in memory now.
2 Likes
We have a ticket for improving the engine profiler to report those kind of stats too, but I can’t tell you at this time when you can expect this implemented.
I will do a writeup on the forum on how to install and quickly get going with GPU profiling on Android, iOS, Mac and Windows as soon as possible.
For your more imminent problem with OpenGL Profiler though. For 8.x version of the XCode Graphics tools:
-
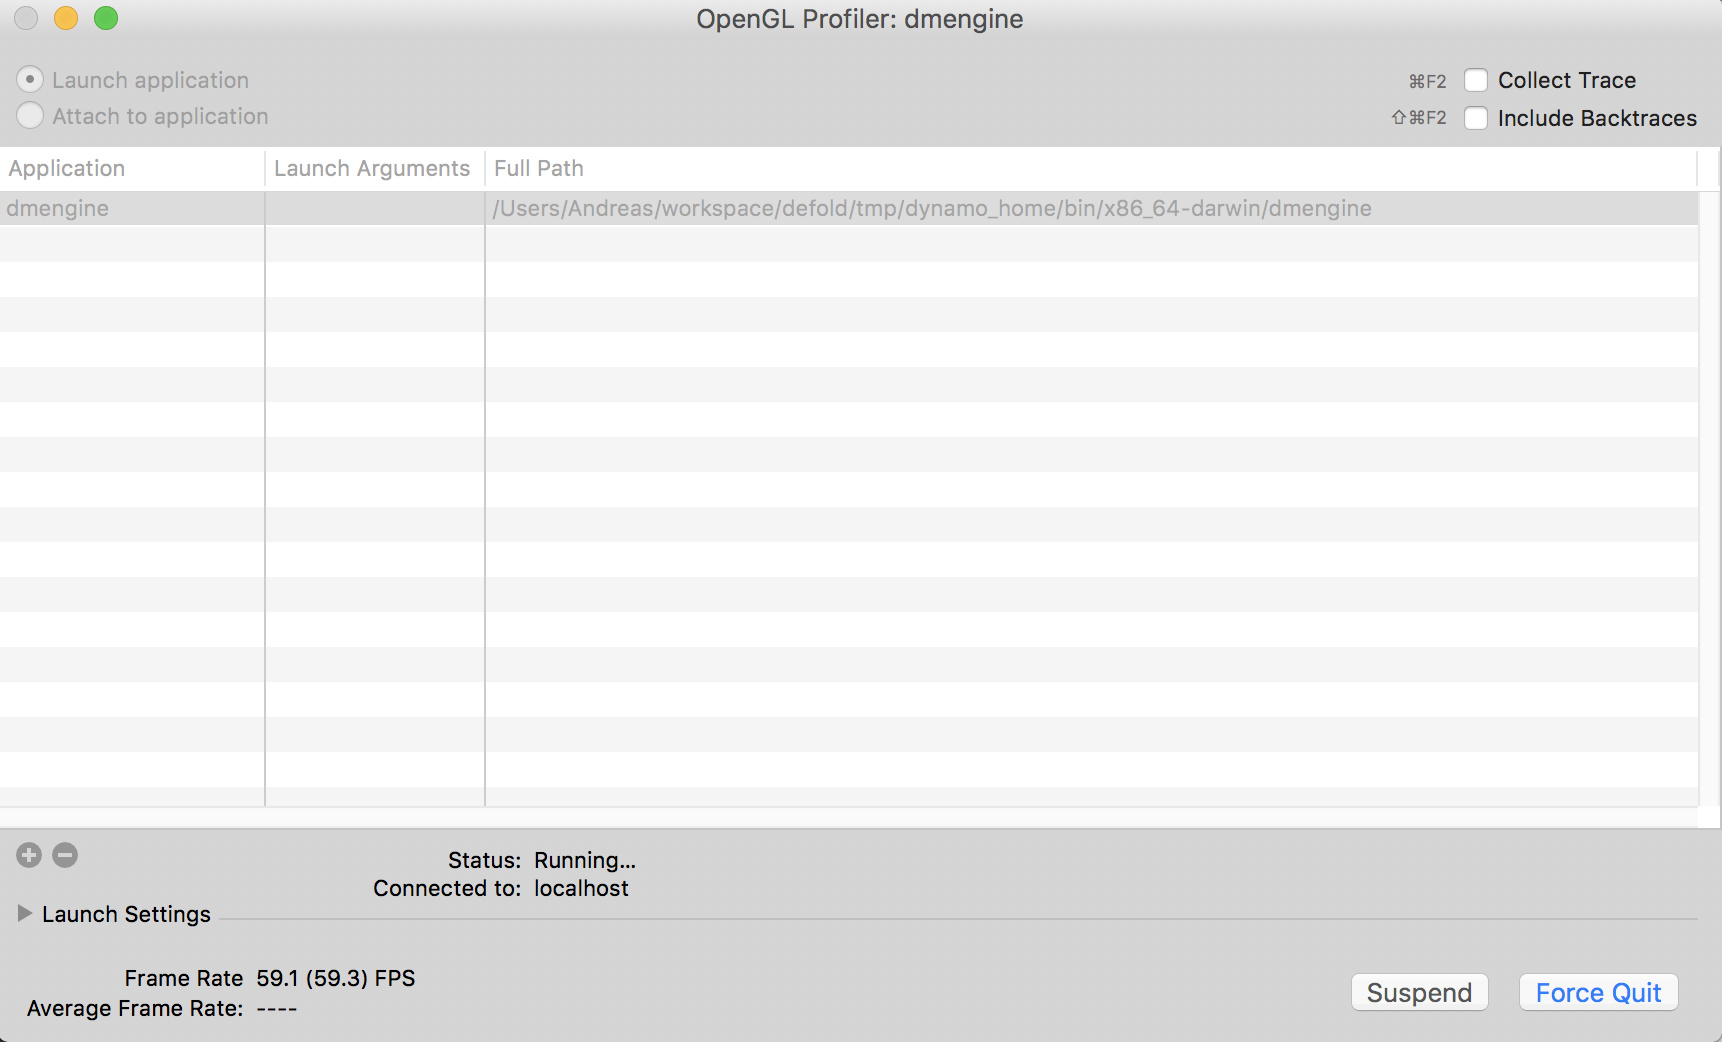
Make sure you got “Status: Running…” when you have launched or attached to an application. If not, you need to enable remote profiling in the OpenGL Profiler preferences. Then choose “Connect to” in the File menu and connect to your machine. This is an issue with Mac OS Sierra and the Profiler tool. They seem to have sorted this in 9.x beta tools which I am running though. It should look like this
-
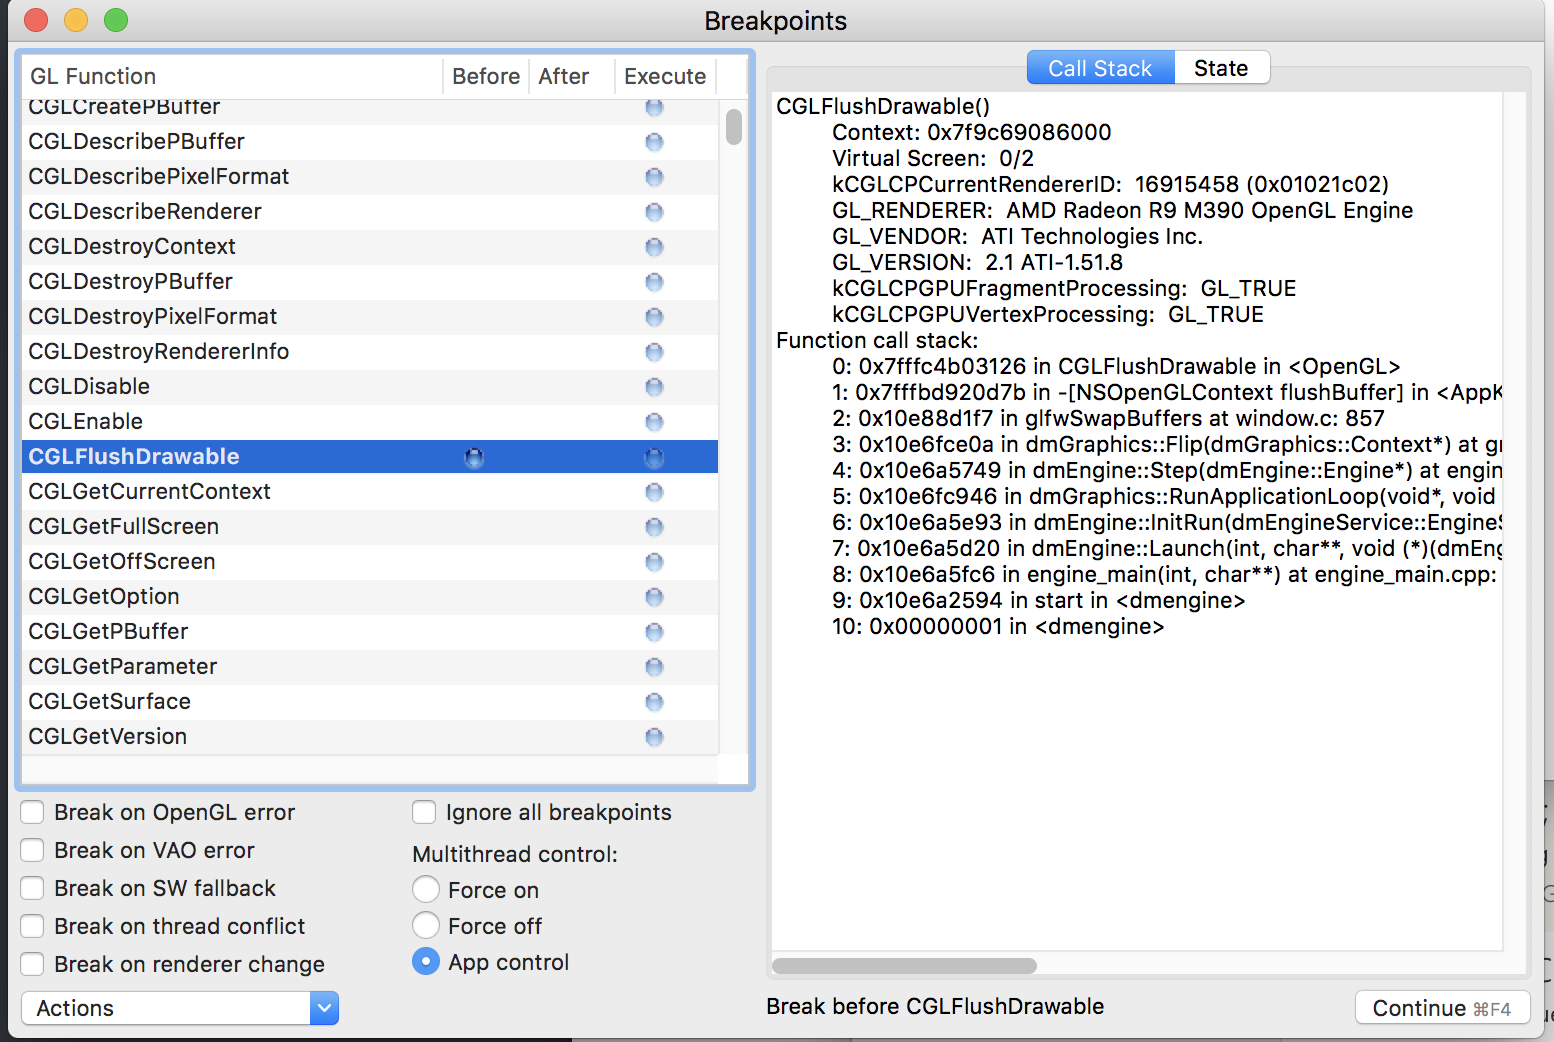
You then need to set a breakpoint. Bring up the break point window from the “Views” menu and set a breakpoint like this. It takes some getting your head around how these works…
-
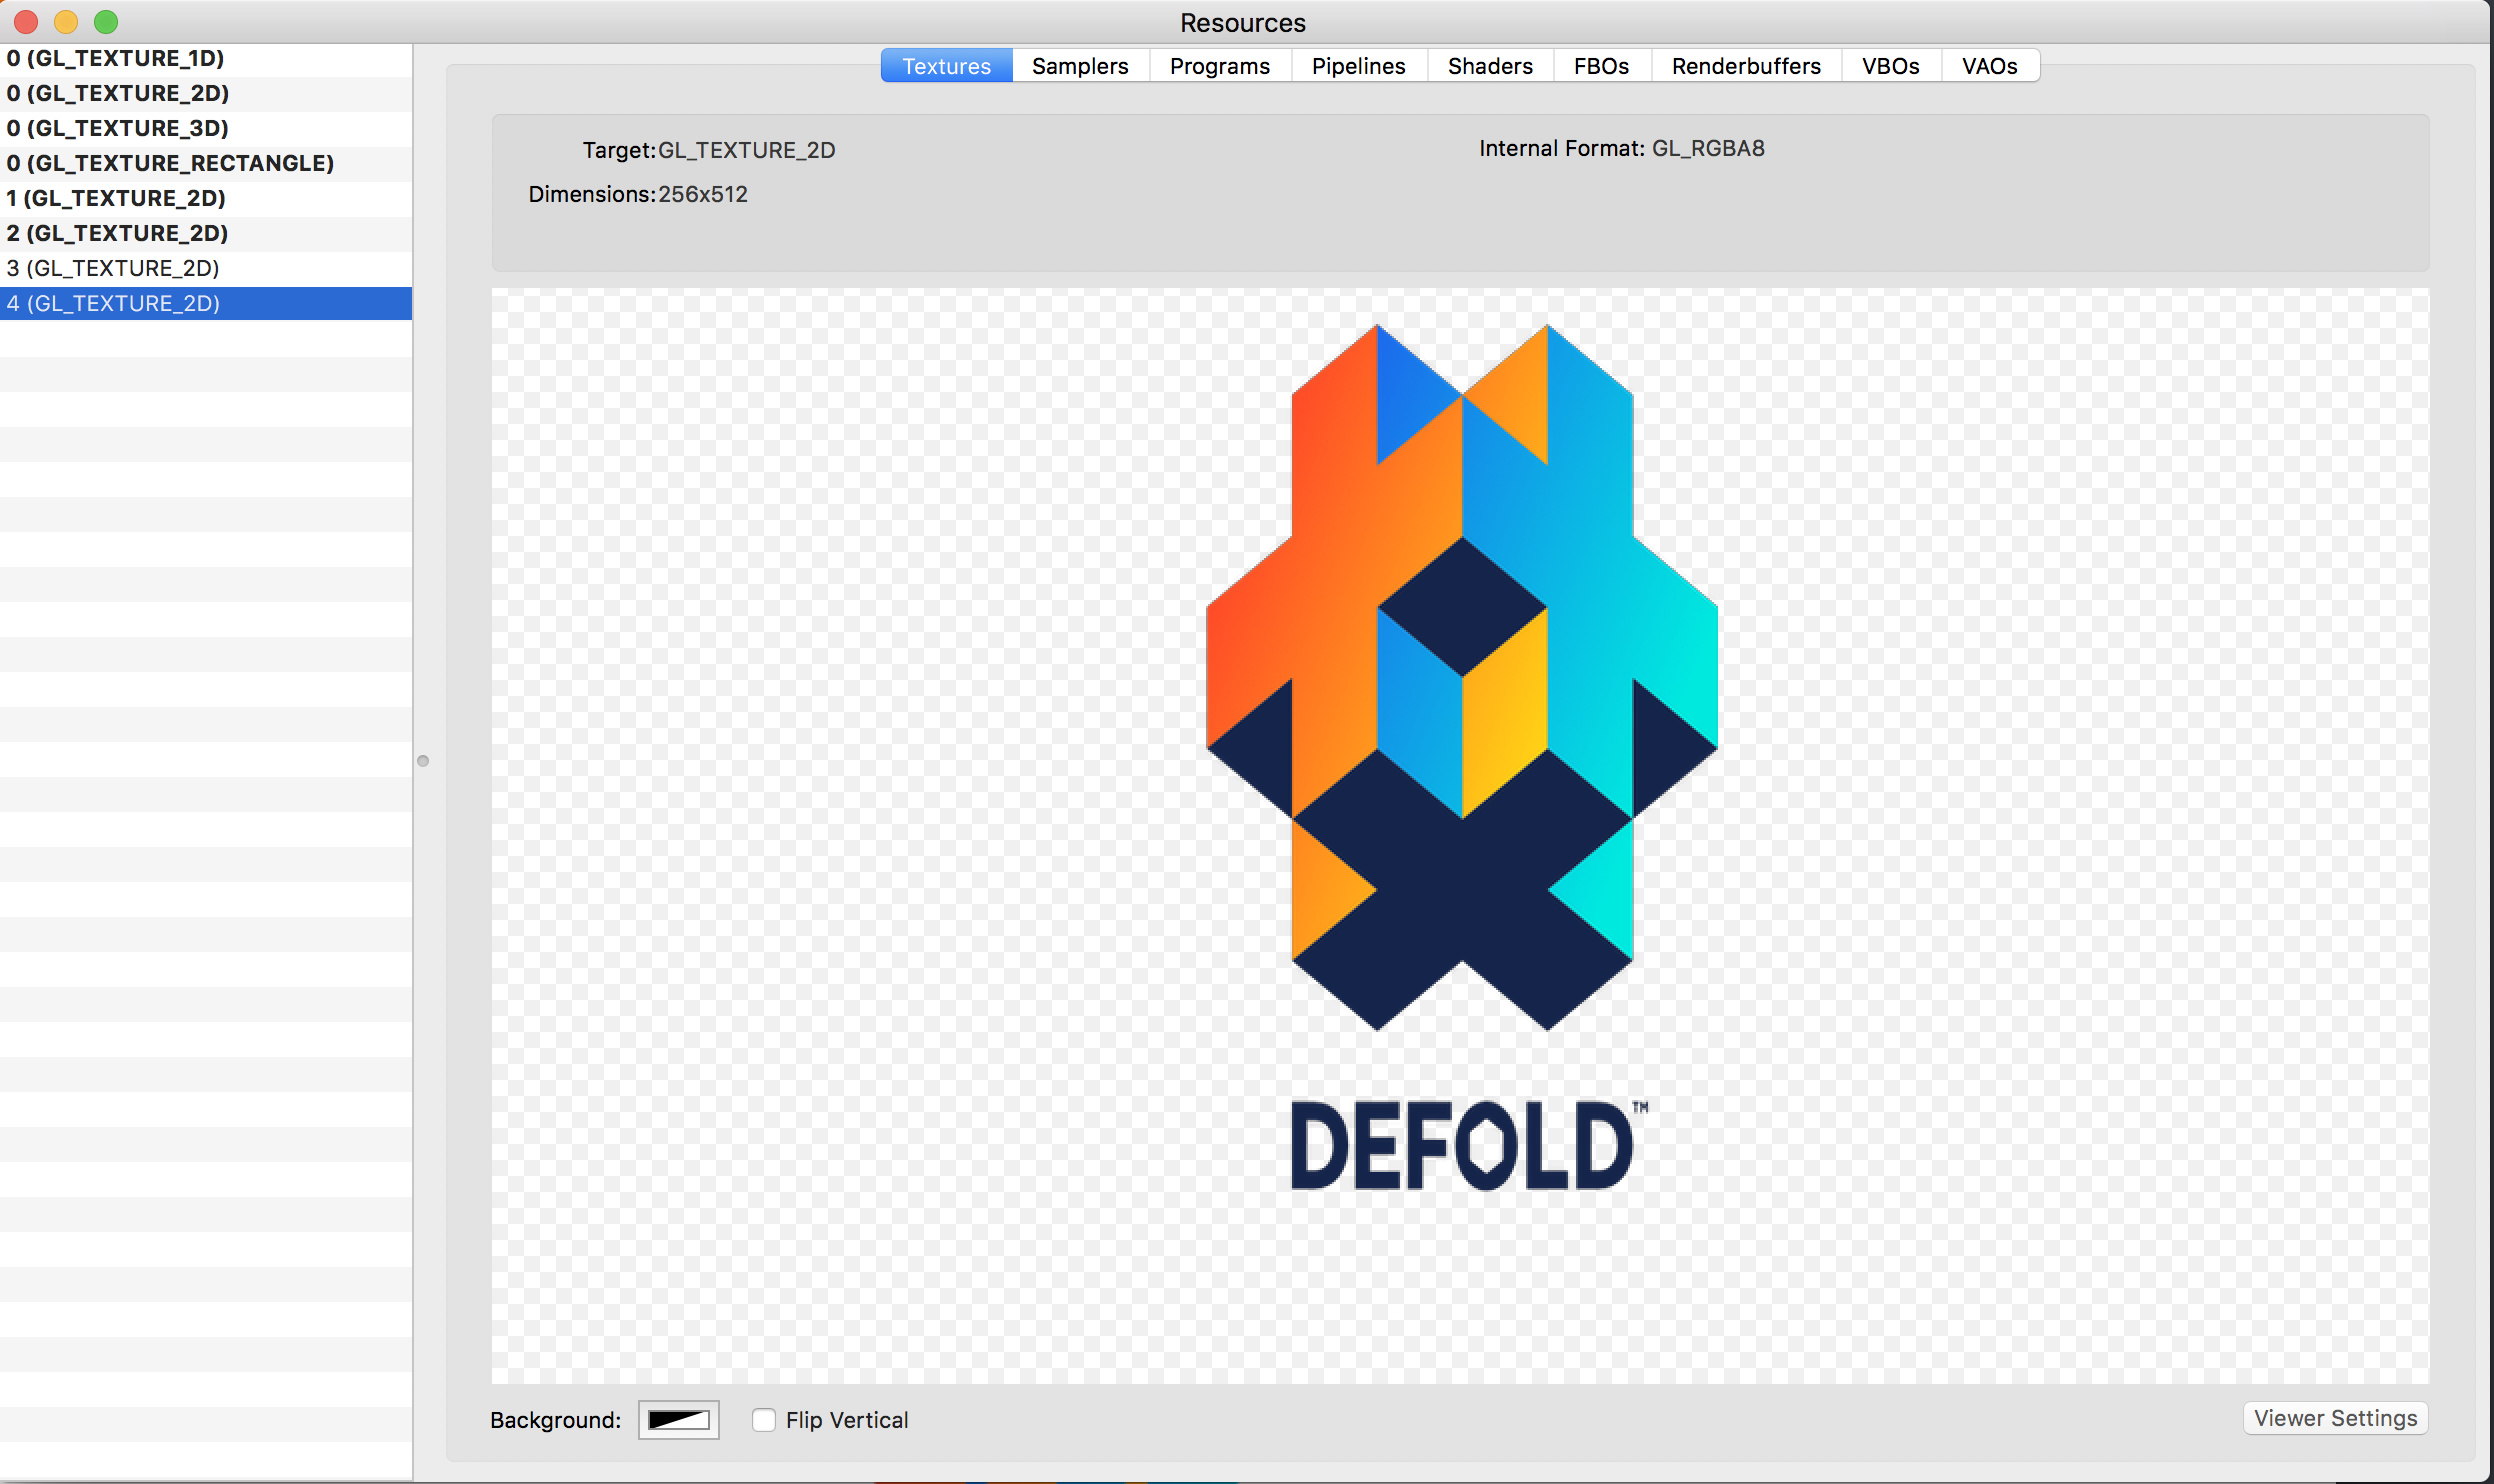
Then, when you the program stops, you can bring up the resources window which should look like this
More info on how to use the tool here: Technical Note TN2178: Real world profiling with the OpenGL Profiler
Let me know if you can’t get this to work and I’ll try to help out.
7 Likes
Super useful, thank you! (I forgot about the breakpoint ( )
3 Likes