When you run Project->Build from the editor you get a debug build. This debug build is broadcasting network presence so that the editor can detect it and it has the profiler enabled. Do you get the same behaviour in a release bundle?
I just started a new project using the Pixel Platformer sample as a template and hit Ctrl+B to run with no changes to the project. I get 14-16% CPU usage on an 11900K as it runs with the bee bouncing up and down.
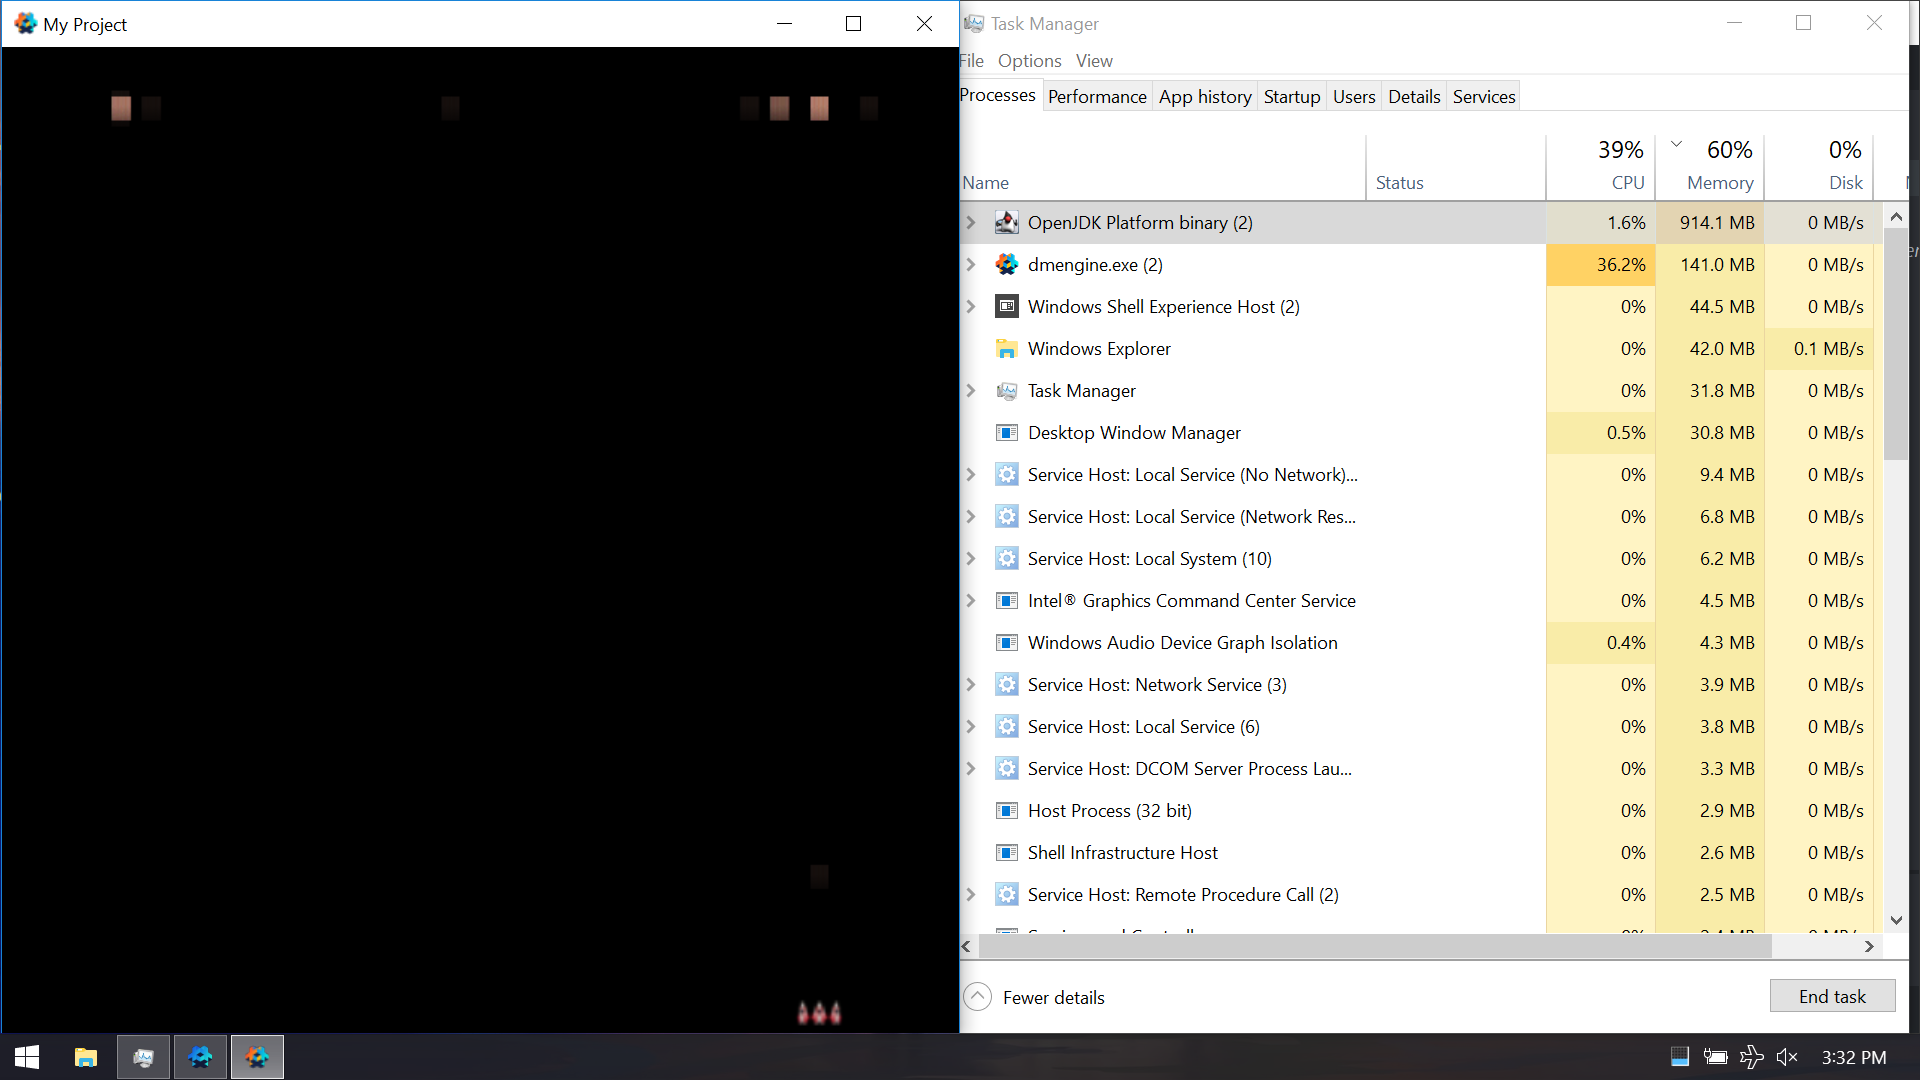
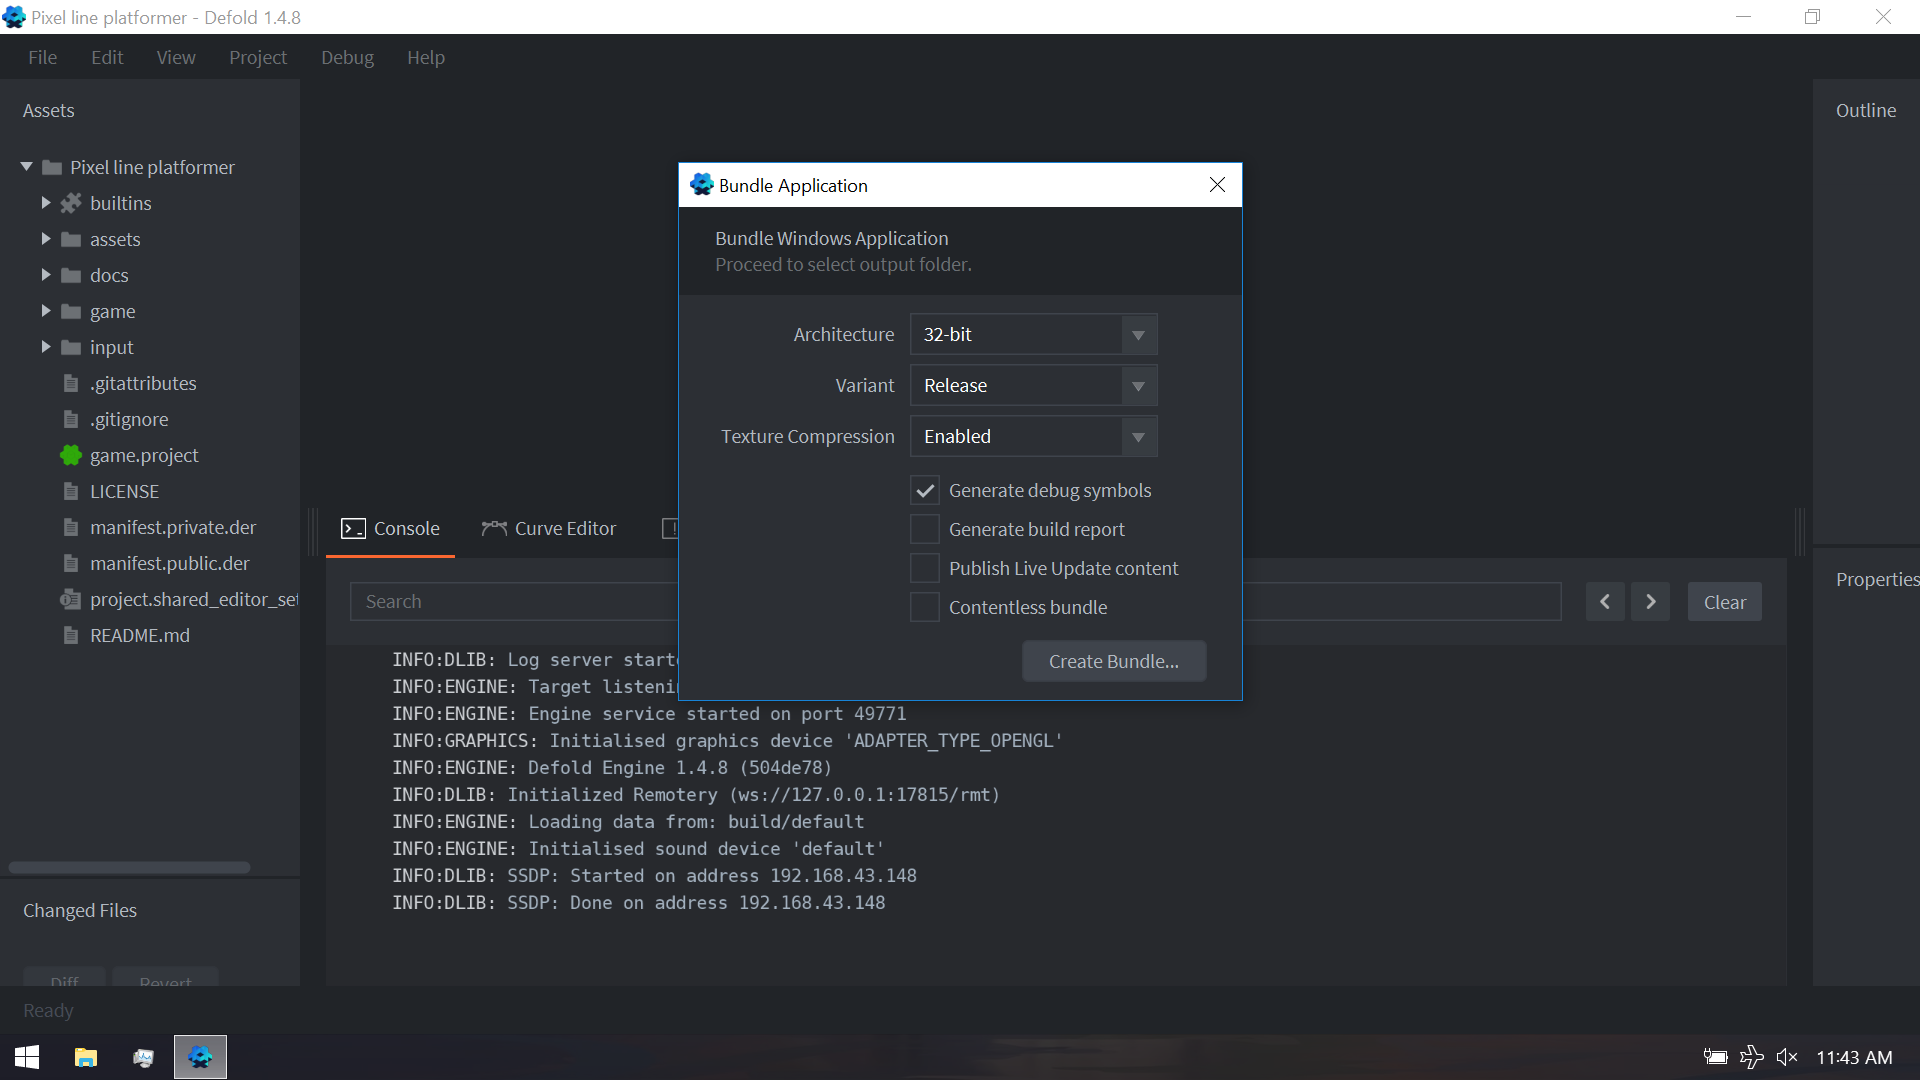
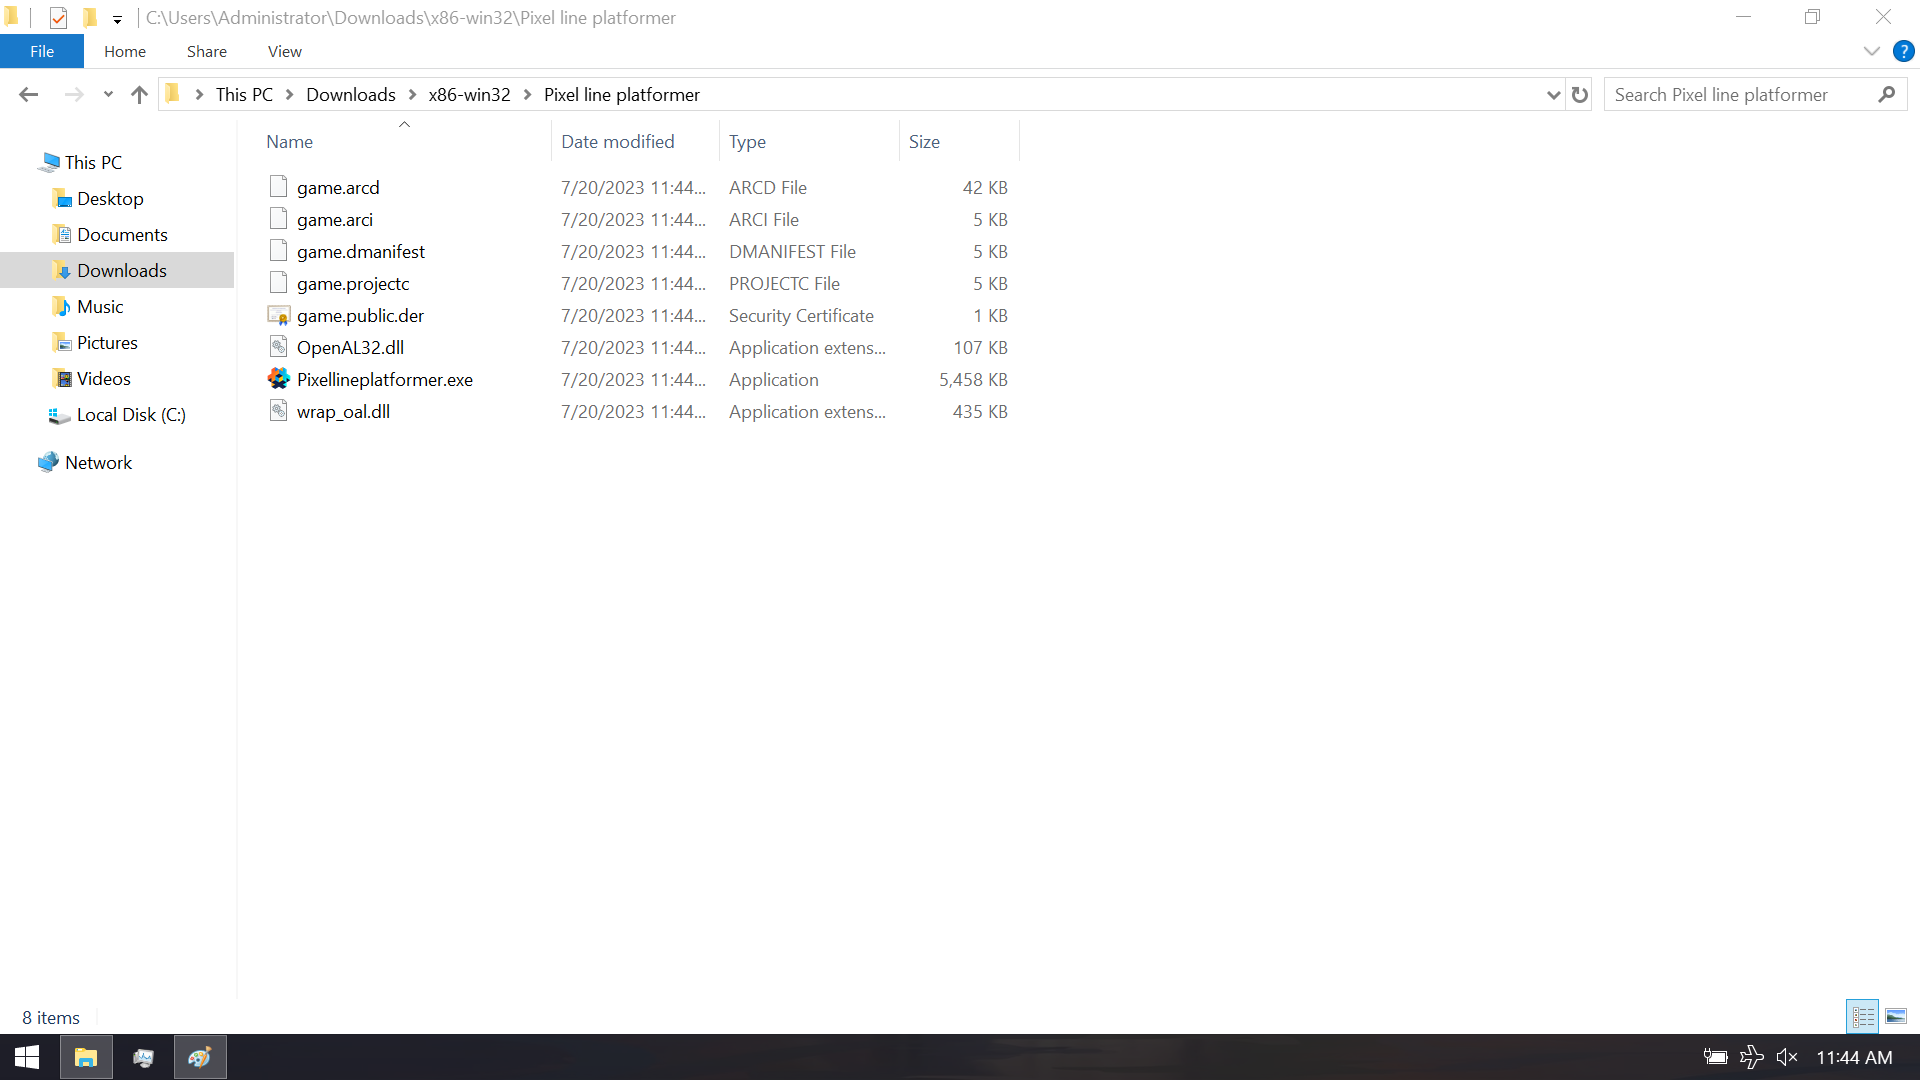
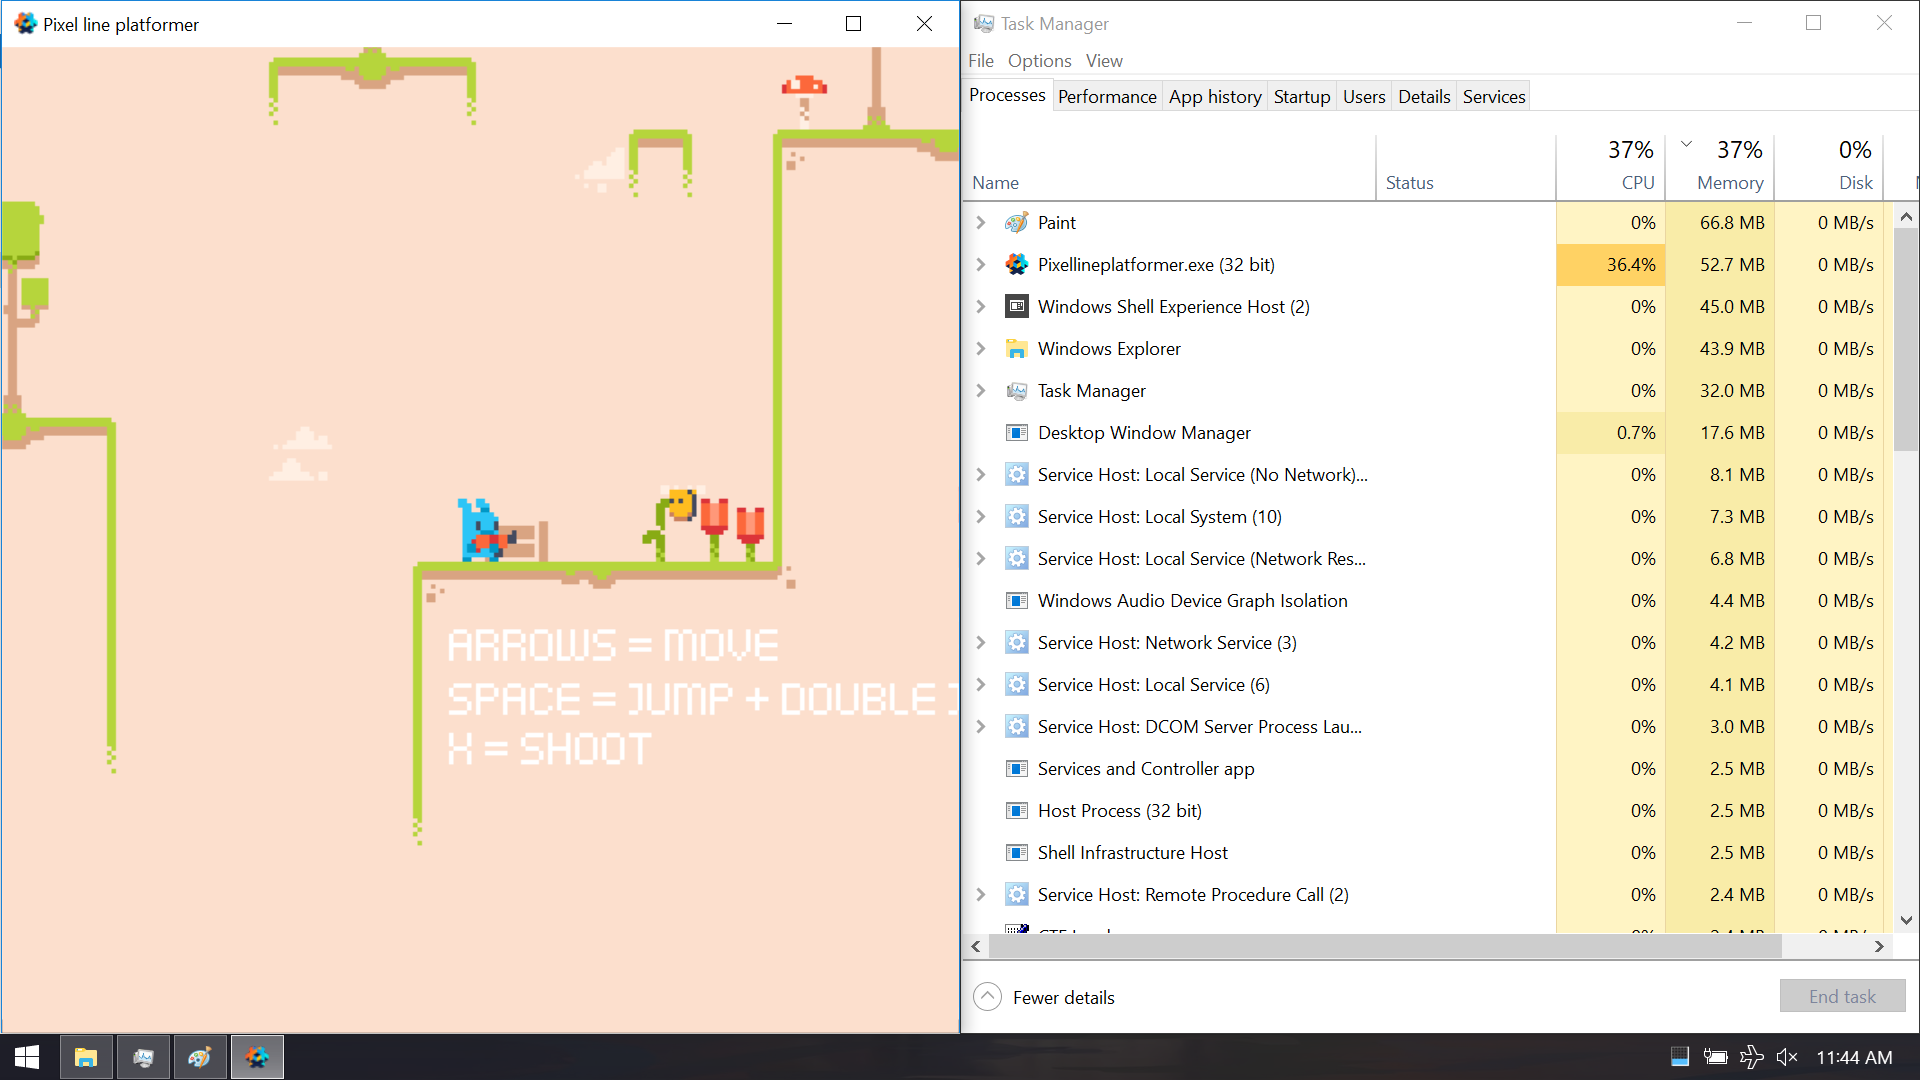
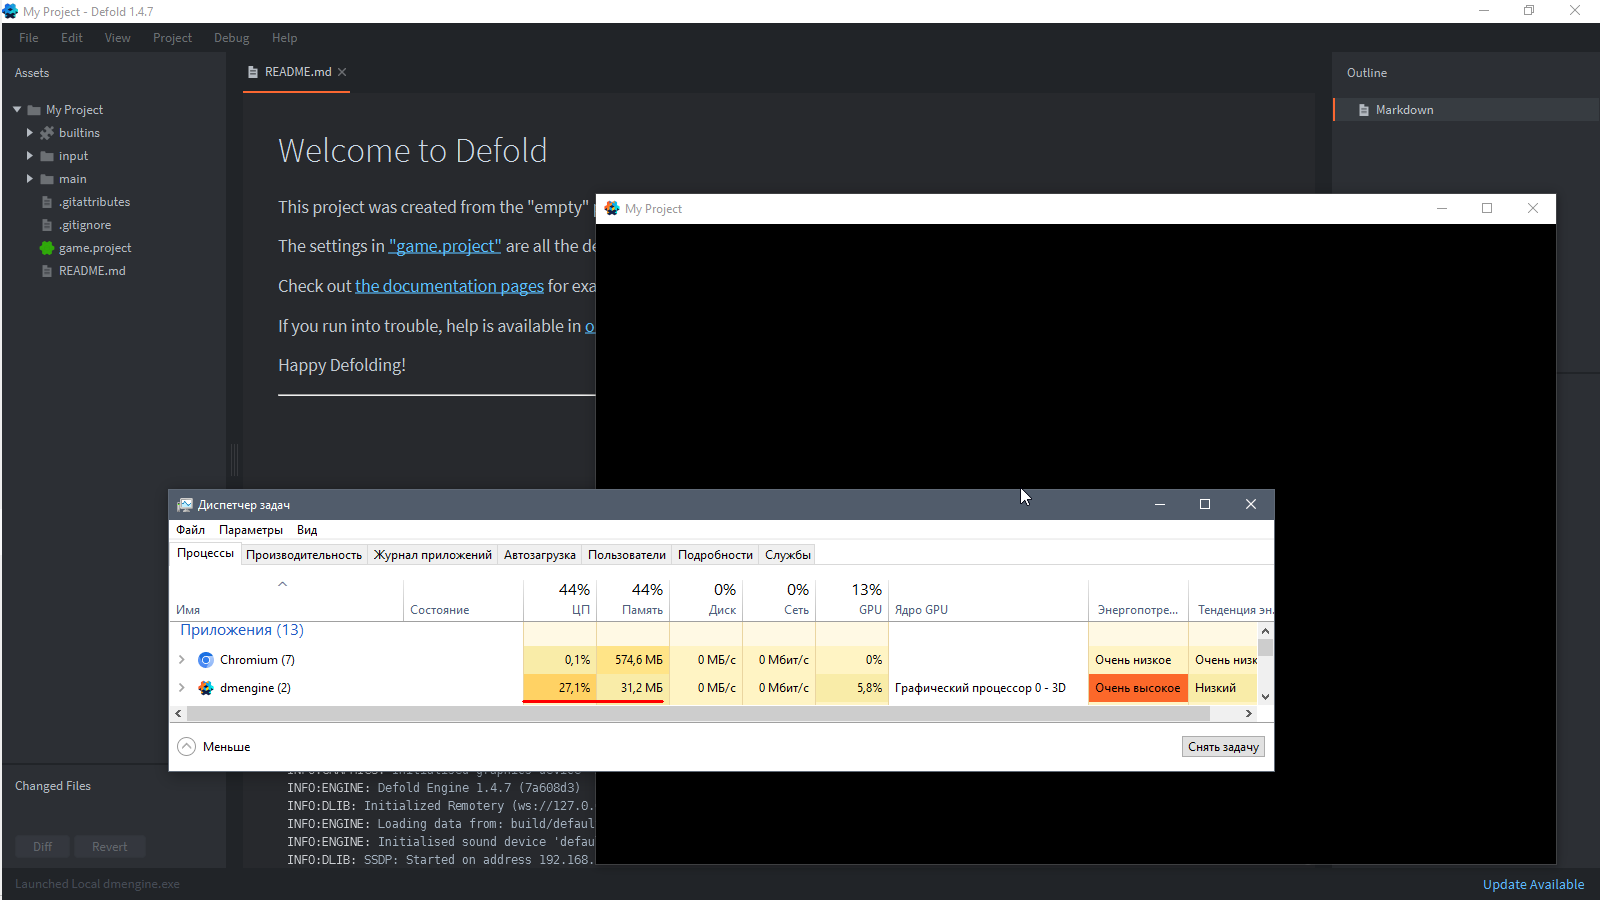
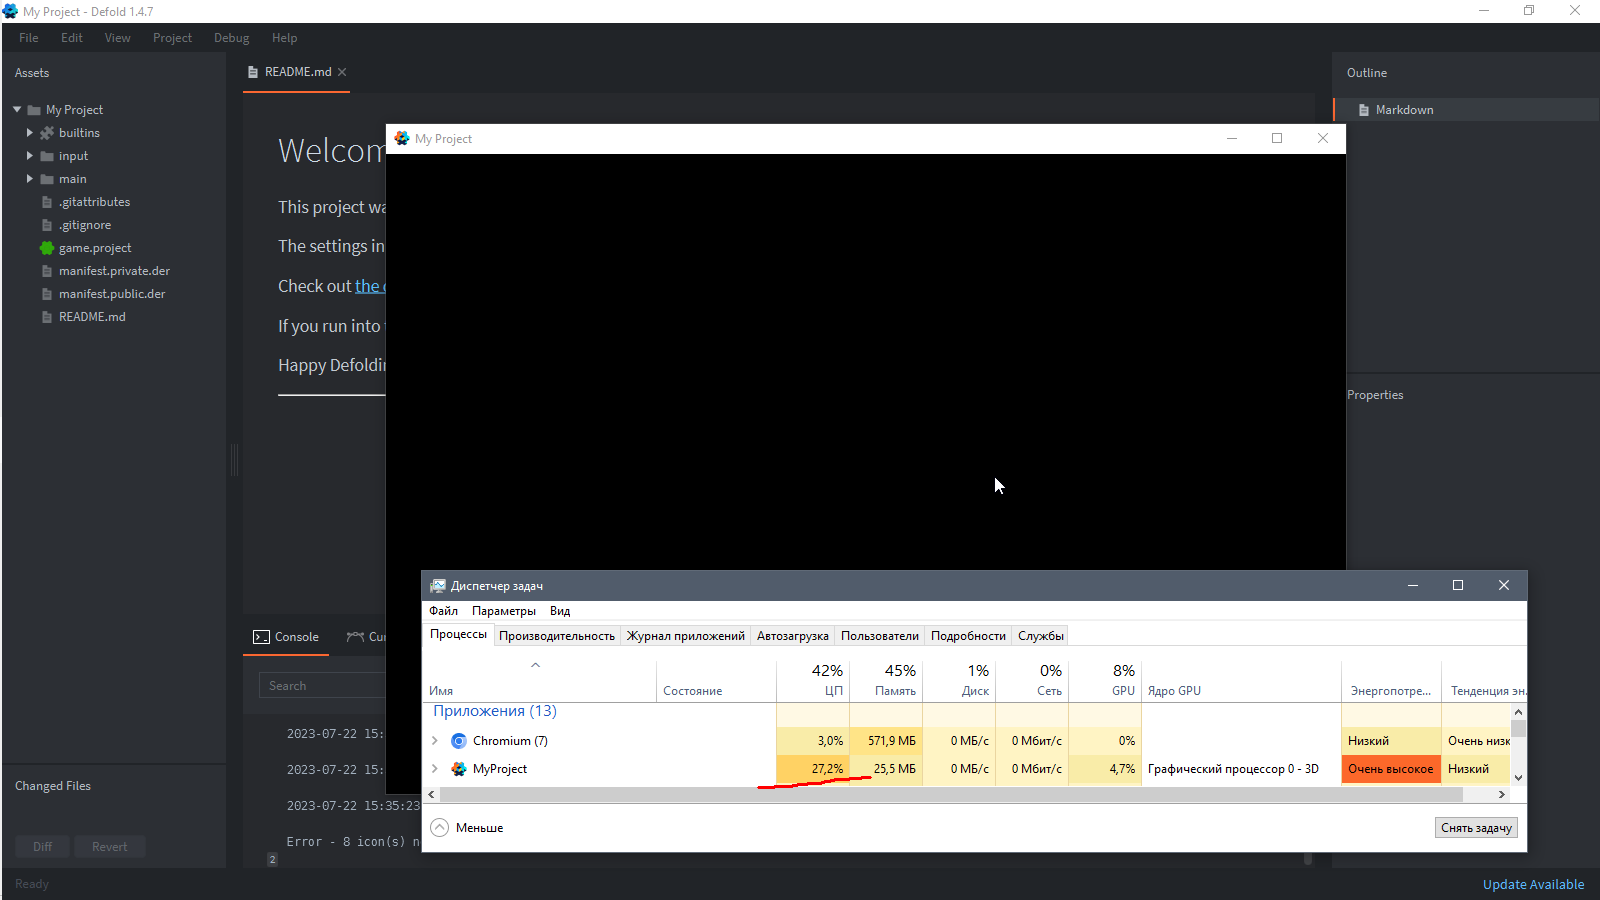
These are results when I exported "Pixel Platformer " demo for 32 bit Machine ( on 64 version CPU usage is slightly high and constant in between 35 to 39 %)
I just exported a Windows build using the same settings you did in your screenshot, release, 32 bit, with debug symbols, texture compression enabled, etc. I get 12.5% steady on the process not moving.
I picked a random project in my list that I could quickly open and run. Britzl’s defold-orthographic master branch cloned from github. The “all features” option in the example project runs at 3% CPU just as a debug build running under dmengine.exe process.
I can’t speak for other games, as I’ve never really had to pay this any attention or needed a release build before. I am also new to game dev.
Edit: I went ahead and bundled the defold-orthographic example project using the same build settings. Moving the guy around and the camera and stuff, I still get 3% CPU usage. It does seem high on the pixel platformer example.
I don’t think you should include debug symbols in a release build, but I don’t think that is the cause of the high CPU usage here. But it’s worth mentioning. Someone please correct me if I’m wrong.
IDK if you are using a Laptop or a PC, But when I am working on my machine and testing my ( ctrl + B ) game then temperature is going high very soon. ( I have a Laptop ).
At this rate, I am not sure that if the size of the game increases, then the CPU usage will be affected or not.
I’m on a PC; the CPU is pretty decent and cooled well. I have 8 cores and 16 logical processors, so it is basically maxing out two of those threads as it runs. There is a difference in performance between our CPUs of about 103%.
The usage may be normal for your CPU, but someone else with more experience with the engine than me should advise.
So I diffed the project settings file between the two projects I mentioned. Several lines were different, but these jumped out at me:
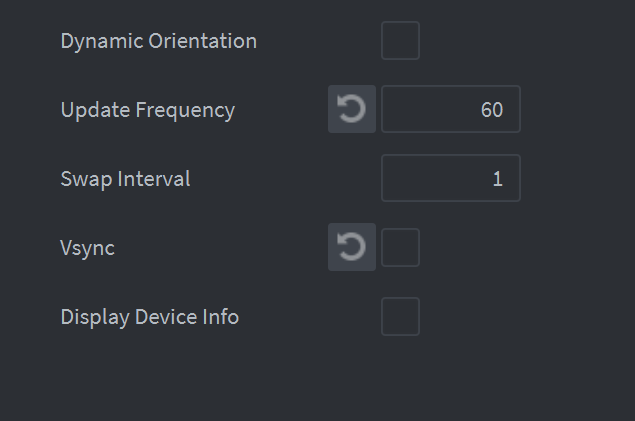
vsync = 0
update_frequency = 60
I reset these to defaults and CPU usage is normal now. Notably, these settings are in the pixel platformer template like this. Try to reset those in the project settings by clicking the revert button (the circle arrow button). This removes them from the game.project file completely. You can search for these settings in the filter box, but they are under display.
Edit: what I meant to say above is that the pixel platformer template probably needs to be fixed.
In your project, double click the game.project file. Then navigate to Display on the left pane. Scroll down, and find these options. Click the revert button to reset them is usually the best thing to do.
As far as diffing the files, I used p4merge and drag/drop into the GUI since I don’t like CLIs. You can do that however you want. This tool just shows both files next to each other and highlights the differences by line.
I’m not sure what the expectation is here?
I might point out that game engines in general don’t work like regular desktop applications, and Defold is no exception.
In short, he goal is to run as fast as possible, to have as smooth framerate as possible.
E.g. disabling vsync, is one way to make it run as fast as possible.
Try removing that variable (it’s deprecated, it’s equal to swap_interval = 0) to see if the project will ease up on the cpu usage.
Personally, I’d look into the overheating at just 40% load. Do you get worryingly high temperatures or is it just that the fans start to spin? Maybe the fan/vents could do with a clean. I’d also add some ram to the system.