Framerate dropping when altering the view matrix

Describe the bug (REQUIRED)
Hi! I was playing around with the camera in defold-orthographic, and after having played my game for a few minutes on my old Samsung, lag spikes started occuring. The framerate dropped more and more for every minute I used the application. After having stripped almost everything from my own script, I found out that it stopped happening when I either turned off the camera follow or stopped moving the game object that was attached to the camera.

Then I went into the orthographic.render_script and tried to set the view matrix to an identity matrix vmath.matrix4(). That made the lag spikes disappear even when follow was ticked. More specifically just

--frustum = proj * view
frustum = proj * vmath.matrix4()

seemed to solve the problem.

My final step was to create a new Defold mobile template project and try to translate the view matrix in the render script. That also caused the lag spikes, so I guess it has nothing to do with the defold-orthographic. In other words:

    self.pos = (self.pos or vmath.vector3()) + vmath.vector3(0.01, 0, 0)
    self.view = vmath.matrix4_translation(self.pos)

placed before calculating the frustum caused lag spikes from a fresh mobile template project on my Samsung.

To Reproduce (REQUIRED)
Steps to reproduce the behavior:

  1. Use Defold 1.4.2.
  2. Start a new Mobile game from templates
  3. Go to default.render_script
  4. Add the lines
    self.pos = (self.pos or vmath.vector3()) + vmath.vector3(0.01, 0, 0)
    self.view = vmath.matrix4_translation(self.pos)

before calculating the frustum in default.render_script.

  1. Print the fps
  2. Run the game for >5 minutes on an old(?) phone (android)
  3. See fps drop over time

Expected behaviour (REQUIRED)
I expect the engine to keep the framerate stable when altering the view matrix.

Defold version (REQUIRED):
-1.4.2

Platforms (REQUIRED):

  • Android 8.0.0
  • Galaxy S7

Screenshots (OPTIONAL):
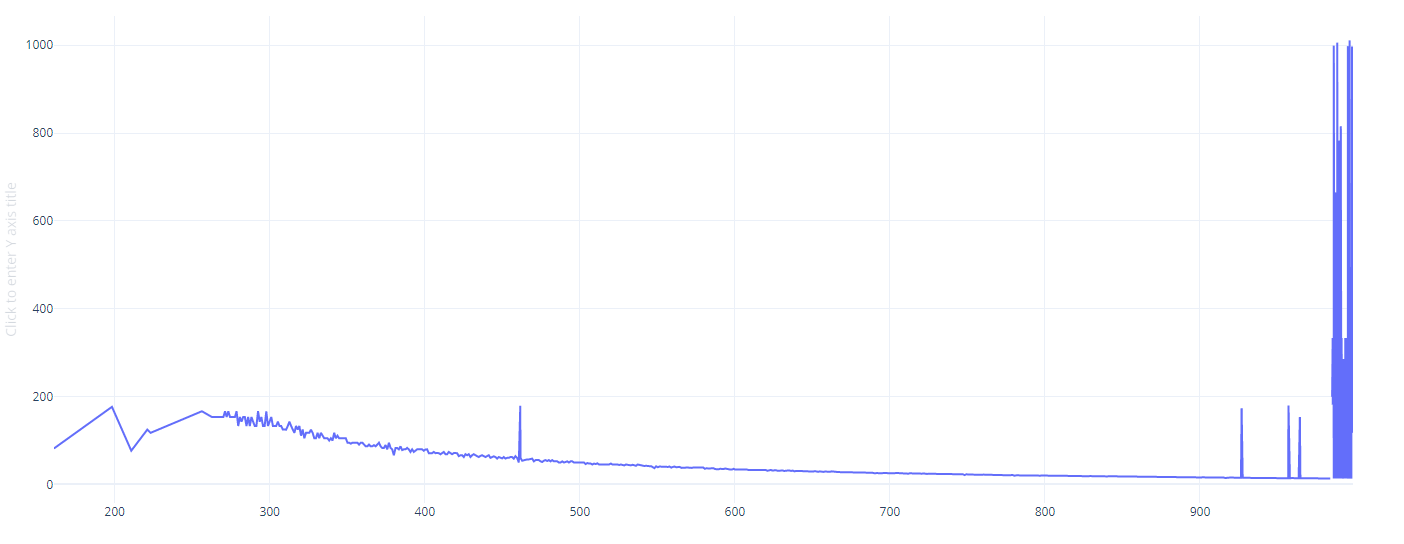
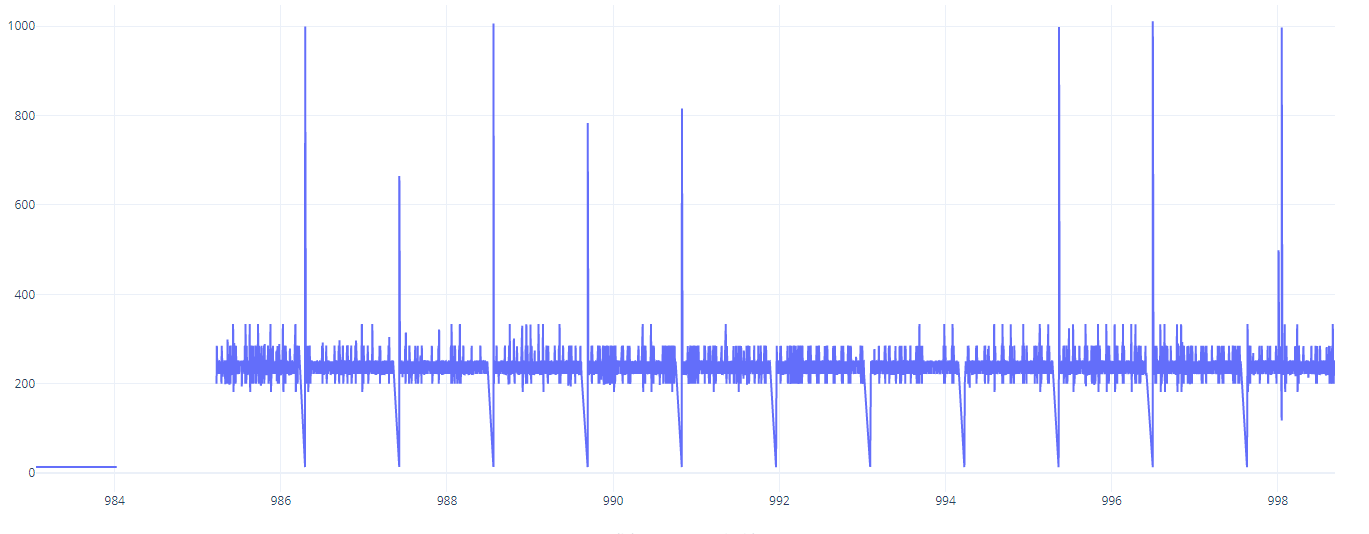
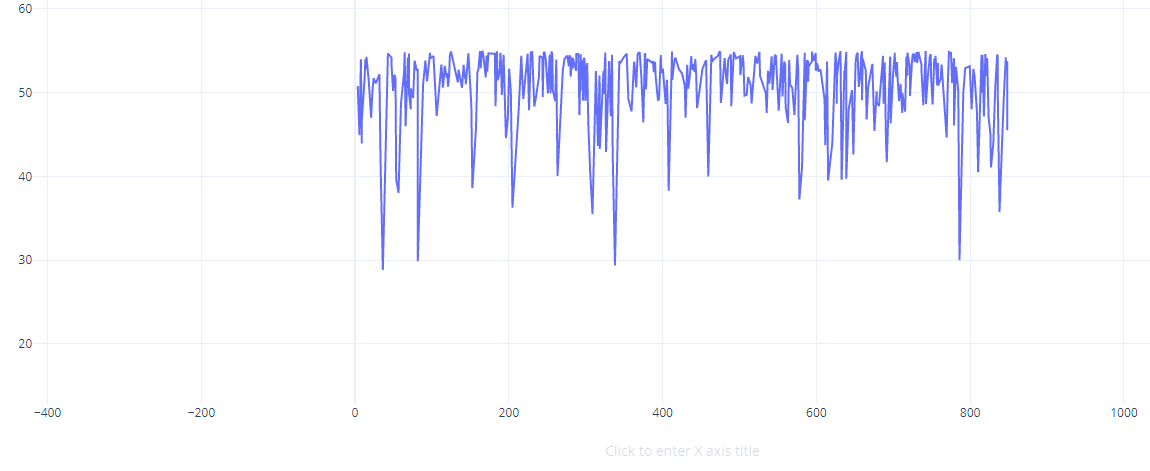
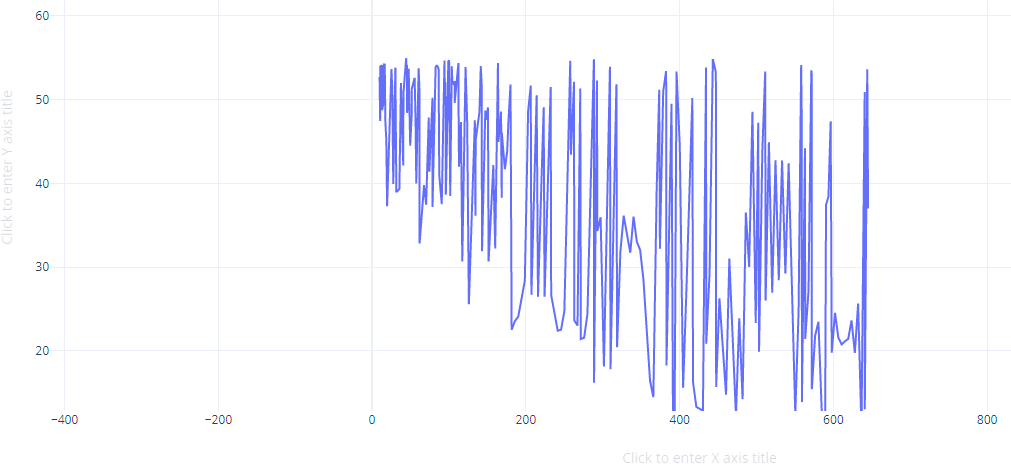
Below are plots of all the occurences when the fps is < 55. In the first picture I am not altering the view matrix. In the second one I am.


Does anyone know what could be the problem here? Thanks! By the way, it’s great to use Defold again!

1 Like

Welcome back @einar ! Thank you for the bug report. We’ll have to do some investigation during next week and get back to you.

2 Likes

@einar does this only happen on your phone? Are you able to reproduce it when running on desktop?

Can you start with a self.pos set to some high value to reproduce the issue? Or does it really have to accumulate a large value over time?

I was able to reproduce it on my desktop as well. I tried both setting the Update frequency in game.project to 60 and to 0. When it was set to 0, I printed all the fps values below 180 giving this graph:

Near the end, after 985 seconds, I printed all the fps values, hence the strange look in the right part of the graph. Zooming in on the right part gave this:


Here, it seems the frame drop is occuring every second. This is followed by a very low dt that, when inversed, sometimes printed Inf.

Setting self.pos to a large value from the beginning doesn’t seem to trigger the framrate drop. The position doesn’t even have to accumulate to a large value, it just has to change many times.

1 Like

I investigated this issue a bit more. As the smallest repro case I could find was just changing the view matrix before calculating the frustum, I checked when frustum culling was added to Defold. Apparently it was introduced in version 1.3.1. So after trying both 1.3.0 and 1.3.1 I got these results:

1.3.0: no changes to default.render_script → no lag spikes
1.3.0: altering the view matrix → no lag spikes
1.3.1: no changes to default.render_script → no lag spikes
1.3.1: altering the view matrix → lag spikes

I also tried different options of vsync, update frequency and swap interval as I saw there were some changes in 1.3.1 regarding those, but in all cases 1.3.1 is the version that introduces the lag spikes for me.

2 Likes

I found yet another lead: After moving the character around for a while in the public example rotate_and_move built and run by Defold 1.4.4, the character started lagging the same way I have seen before. I’d say the spikes became visually noticable after 7-8 minutes.

The new thing I found this time was that the moment I stopped moving the player, the fps recovered. I printed the values so it wasn’t just that I couldn’t see it. And then when I continued moving again, the fps spikes came back every second and they were also getting lower and lower as before.

I have yet not tried the browser version of rotate_and_move, but if it was built with Defold <= 1.3.0 my guesses are it won’t be reproducible there.

What I did try, though, was to again just disable the frustum. This time by replacing the two lines

    render.draw(self.tile_pred, {frustum = frustum})
    render.draw(self.particle_pred, {frustum = frustum})

by

    render.draw(self.tile_pred)
    render.draw(self.particle_pred)

which removed all the spikes even while moving the camera / altering the view matrix. For me customizing the render script this way is a good-enough workaround for the time being.

2 Likes

And this only happens on Android? Are you able to reproduce it on desktop?

In the case of no frustum, we don’t do any extra calculations, we just render everything.
In the case of using a frustum matrix, we go through every component to determine its visibility. Question is, how many component/instances do you have? What does the profiler say?

I opened up this project to test on my Android phone, and did notice two things:

  1. There are no touch controls to move, only to fire (so I added it)
  2. The bullets you fire never get deleted (I fixed that)

I’ve also been running the example using Defold 1.4.5 (3dbbf1dbebd3a8146f6a917d101882a61f56afdc) for 10+ minutes there are no visible lag spikes. I’m testing on a mid range Sony Android phone.

Some thoughts:

  • Could it be that you fired a lot of bullets while testing? In previous versions of the example the bullets were not deleted. This might explain it, although unlikely since Defold should be able to handle this even on a low end phone. BUT it is worth exploring.
  • Could it be GPU related? It seems like the S7 either has an Adreno 530 or Mali T880 GPU (depending on where or when it was bought). My Sony has an Adreno 619.
  • Are you able to reproduce this on more than one device?
1 Like

@britzl
I think you have to move at all times. I just locked the movement, effectively making the player walk in circles for 7 minutes. I did not fire any bullets. I can reproduce it on my high-end desktop computer and on my shitty Android (although that was on my own project and the empty starter project – I will try rotate_and_move there too).

@Mathias_Westerdahl
I can reproduce this on a minimal starter project with 1 main.collection, 1 go, 1 script so the amount of components is very low. The profiler when running rotate_and_move shows these results:

After 5 minutes while moving:


Screenshot 2023-04-26 102004

After 10 minutes while moving:
Screenshot 2023-04-26 102325

This Wakeup part increases in size for every minute run and occurs every second.

1 Like

Then I’d say you’ve found the next lead.
Not sure why that profiler thread takes such a long time, and why it would affect the main thread at all.
Perhaps something is going wrong with the communication between the two threads.
However, I fail to see how that is related to the frustum matrix though :thinking:

Could it be that the increase of time in the profiler thread is a symptom of the long main thread frame? In the last picture the main thread frame spends 45 ms instead of the usual ~4 ms the previous and following frames spend, where most of time time is spent in DrawRenderList.

Sure, it’s possible. There is some communication between them.

You should be able to see the more detailed scopes of the Main and Remotery threads in the Web profiler.

Also, inspecting the frame you’ve selected, the Frustum Culling takes 0.001ms, which is basically nothing. So I’m thinking it’s not related at all.

@einar what if you run a release build where the profiler isn’t enabled? Does the problem still happen?

Is this the more detailed scope you’re referring to?

Normal main frame:
Screenshot 2023-04-26 112156

Spike main frame:
Screenshot 2023-04-26 112216

Spike profiler frame:
Screenshot 2023-04-26 112304

2 Likes

Thanks!
Yes, that SendSampleTreeMessagedoes both a push to the Web profiler, but also to our internal profiler, which resides on the main thread.

I suspect that it is related to something around that, making the DrawRenderList stall (possibly waiting for a mutex)

1 Like

When running a bundled release build the problem does not occur.

It does occur when running from the editor or bundling using Variant:Debug (Android or Windows).

I guess it’s still a bit of mystery why passing a varying frustum to the draw call triggers the lag. Let me know if there’s anything else I can test.

Thanks!

The reason a release build doesn’t exhibit the behavior is that the profiler is then excluded from the build.

1 Like

I’ve tried to reproduce this with the rotate_and_move example, with the ingame profiler on, and also monitoring with the web profiler, but I don’t see any frame spikes at all unfortunately.

Not sure how to reproduce in a more representative manner :thinking:

Perhaps I could create an example project and upload it here. In rotate_and_move it’s cruical that the player is moving constantly. I will also try to reproduce it on an iPhone and a mac.

5 Likes