Defold comes with a built in profiler that can be accessed from within a running Defold game as a visual profiler. The engine also comes with a built in webserver that can be used to, among other things, access profiler data from a browser. This is a powerful way of inspecting the performance and different metrics of a running Defold game.
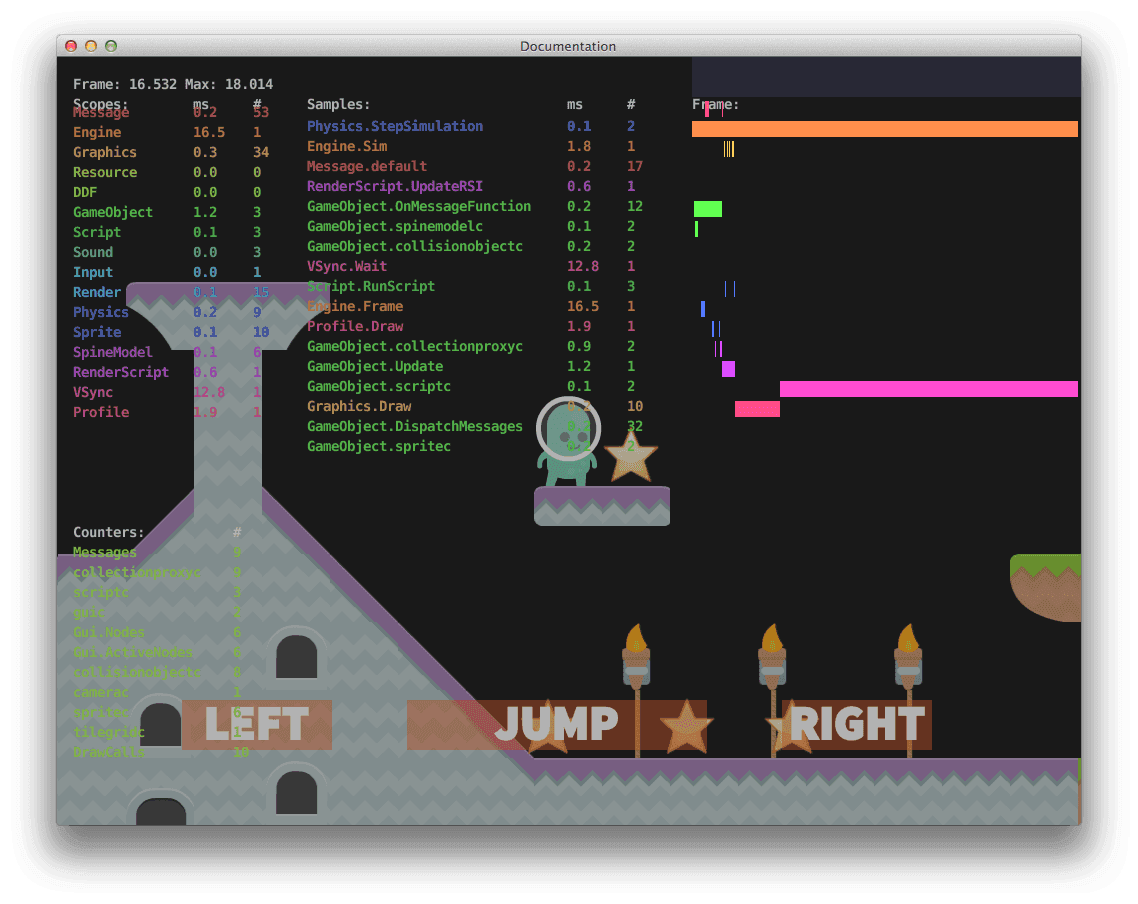
The visual profiler
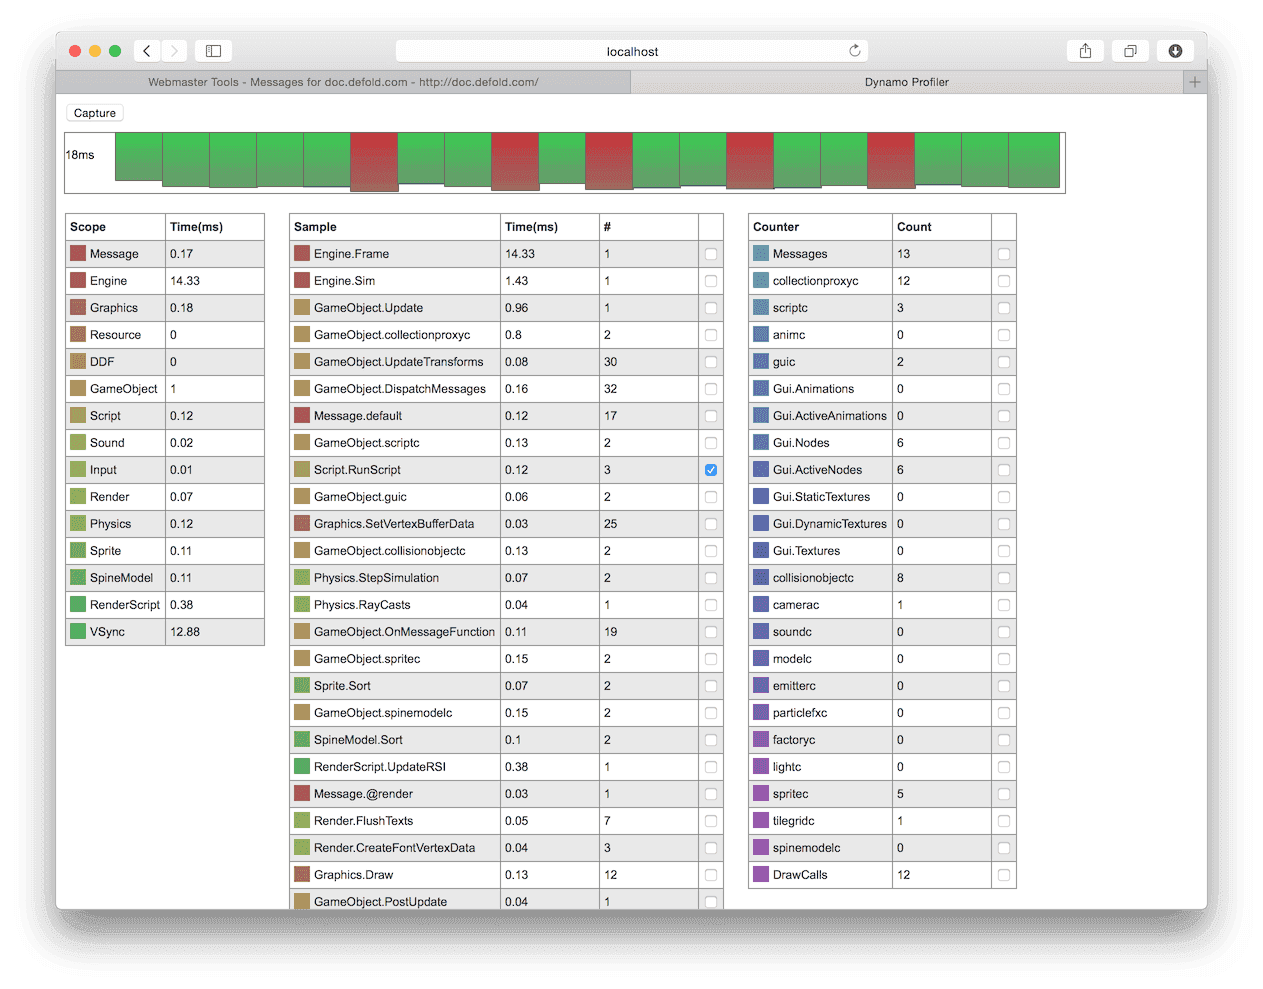
The web profiler
The web and visual profilers covers all use cases except one: What if you wish to be able to programmatically access the profiler data? One use case for this would be to run automated tests or a bot of some kind while pulling metrics such as FPS and drawcalls from the engine and plot these values over time or maybe even fail builds if draw calls or some other metric go above/below a certain threshold.
We have a ticket in JIRA to get profiler data as a Lua table (DEF-1900 - Get profiler values as a Lua table) but it has so far not been given a very high priority. This is after all something that is nice to have and not critical bug so I would not expect to see this in a Defold release anytime soon. Now, the need for something like this has recently been increased since a project I’ve been working on has shown signs of performance issues. When inspecting the game using the web profiler it showed a huge number of draw calls which obviously will have a great impact on performance on low end devices. I gave this some further though and through a stroke of genius (or moment of divine clarity?) I came up with the idea to use the same method as the web profile and pull profiler data from the engine. Kind of obvious once you think of it, right? So, without further ado I present the DefPro library project!
The DefPro project is a Defold library project that can either be included in a running Defold game and used to pull profiler data from the game itself (or in theory another running Defold engine) and either process it and send it somewhere else or display it in some way, perhaps as a tiny dashboard showing only the metrics you care about. The project can also be used from the command line to pull profiler data to integrate in a build process or automated test suite. Check out the project page on GitHub to learn more and try it yourself!
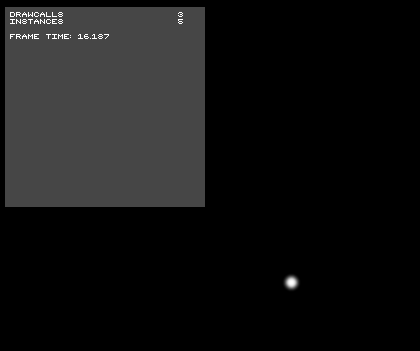
Show metrics inside your game
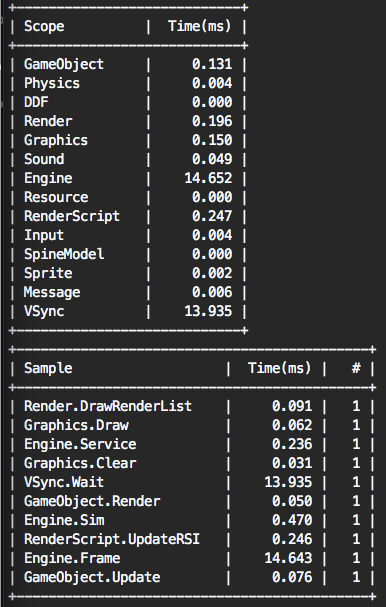
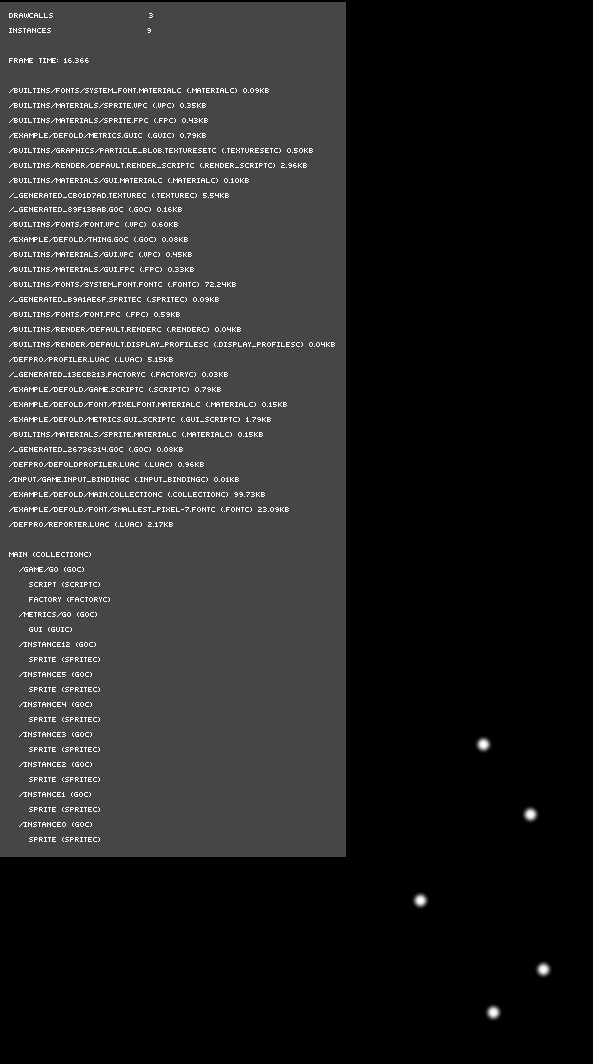
Show metrics in the terminal