There are several broken links and images I found in the “Manual” section, I think I checked all pages in the “Manual” section, I specify each page and put a quote from part of that page so it would be easier for you to find them. @britzl
- In page Installing Defold broken link
If you run into any problems starting the editor, opening a project or running a Defold game please refer to the Linux section of the FAQ.
- Defold glossary, the manual in this link is moved to another place so it’s better to change the link to that page.
An animation set resource contains a list of .dae files or other .animationset files from where to read animations. Adding one .animationset files to another is handy if you share partial sets of animations between several models. See the 3D graphics manual for details.
- Defold for Flash users, link to an existing page but not existing anchor
A common pitfall occurs when working with collection proxies - please refer for this section of the input manual for more information.
- How to get help, link to an existing page but not existing anchor
You can also write engine logs to a file and access this once the application has been shut down. You can read more about how to enable and access the log in the Debugging manual.
- Defold project settings, link to an existing page but not existing anchor
Setting
swap_intervalis done by sending a message to the system socket:swap_interval
- Animation in Defold manual, broken link
To run an animation during runtime you use the
sprite.play_flipbook()function. See below for an example.
same page, link to an existing page but not existing anchor
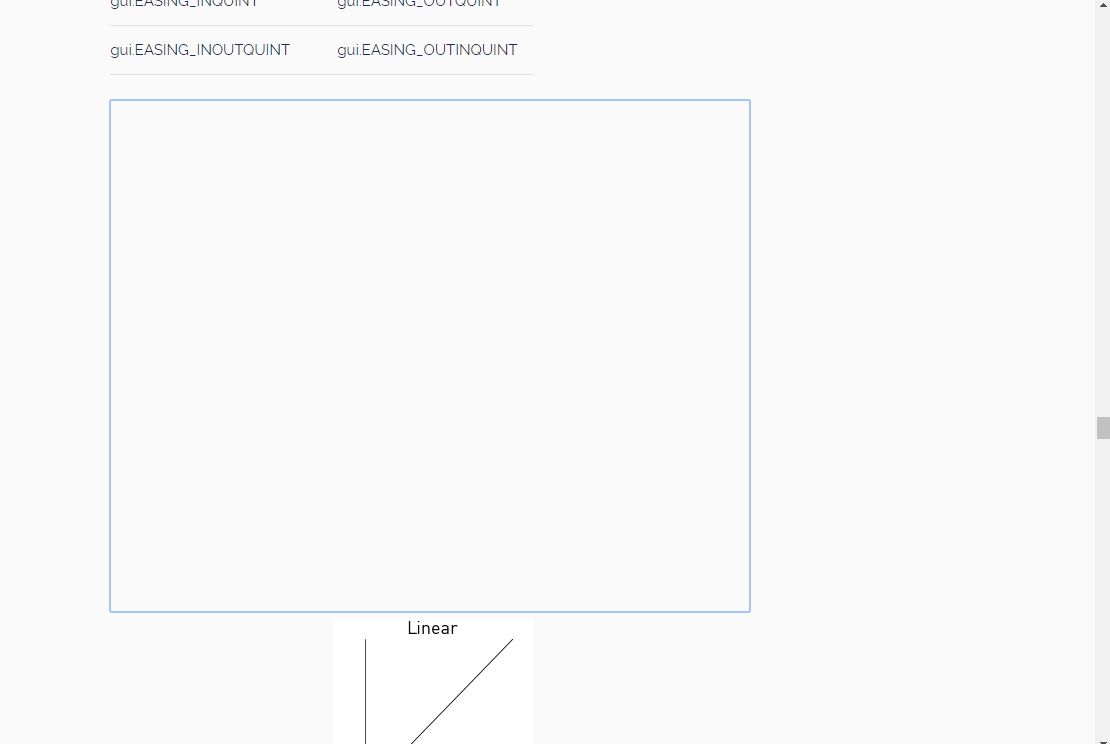
To run an animation during runtime you use the
gui.play_flipbook()function. See below for an example.
the same page, there is a gap in the middle of the page:
7. Adapting graphics to different screen sizes , wrong anchor
This can easily be achieved in Defold using the render script and the Fixed Projection set to a suitable zoom value.
- Texture profiles in Defold, broken anchor
See Compression Types below for more details
- Collection factory manual, broken anchor
Call
collectionfactory.create()when you want to spawn objects
- Collection proxy manual, broken link
See
set_time_stepfor more details
- Camera component manual, two broken link
- Rendercam (2D & 3D) by Ross Grams.
- Ortographic camera (2D only) by Björn Ritzl.
12.Physics in Defold, broken anchor
Joints can currently only be created programmatically using
physics.create_joint():
- Sound in Defold, broken anchor
when you have a sound component set up properly, you can cause it to play its sound by calling
sound.play():
- Defold GUI Spine nodes, broken anchor
Spine nodes can be controlled in runtime through script. To start an animation on a node, simply call the
gui.play_spine()function:
- GUI layouts in Defold, broken link
To change this behavior, either supply your own modified render script, or use a camera library.
- Device input in Defold, broken anchor
Gamepads (as supported through the operating system and mapped in the gamepads file)
two broken link
the pointer over example or the button example to learn more
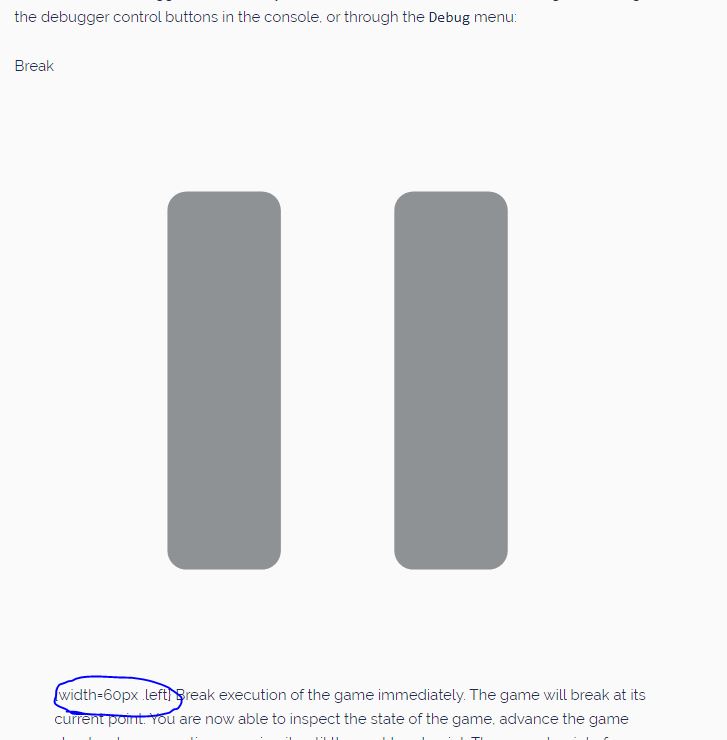
- Debugging in Defold, all debugger control buttons images
16.Bundling an application, broken anchor
but optional platform specific configuration is done in the “game.project” project settings file.
same page, broken anchor
Creating an HTML5 application bundle as well as optional setup is documented in the HTML5 manual.
17.Running the development app on device, broken anchor
While the game is running, you can use hot reloading as usual
- Facebook Instant Games, broken anchor
See the HTML5 manual for details on how to customize your bundled app
and lifecycle hooks