Optimising
Loaded Textures
There are a few way to see which textures are currently in memory. You can use the OpenGL Profiler to actually see the atlases and how they look. You can also use Defold’s Web Profiler and the accompanying Resource view to find out the names of the used textures.
It is always harder to find out why your atlas is currently in memory and not if.
Web profiler
A lot of people are familiar with the Web Profilers CPU view, but Defold also have a Resources view that is highly valuable when checking what is loaded. You can switch view in the top left corner.
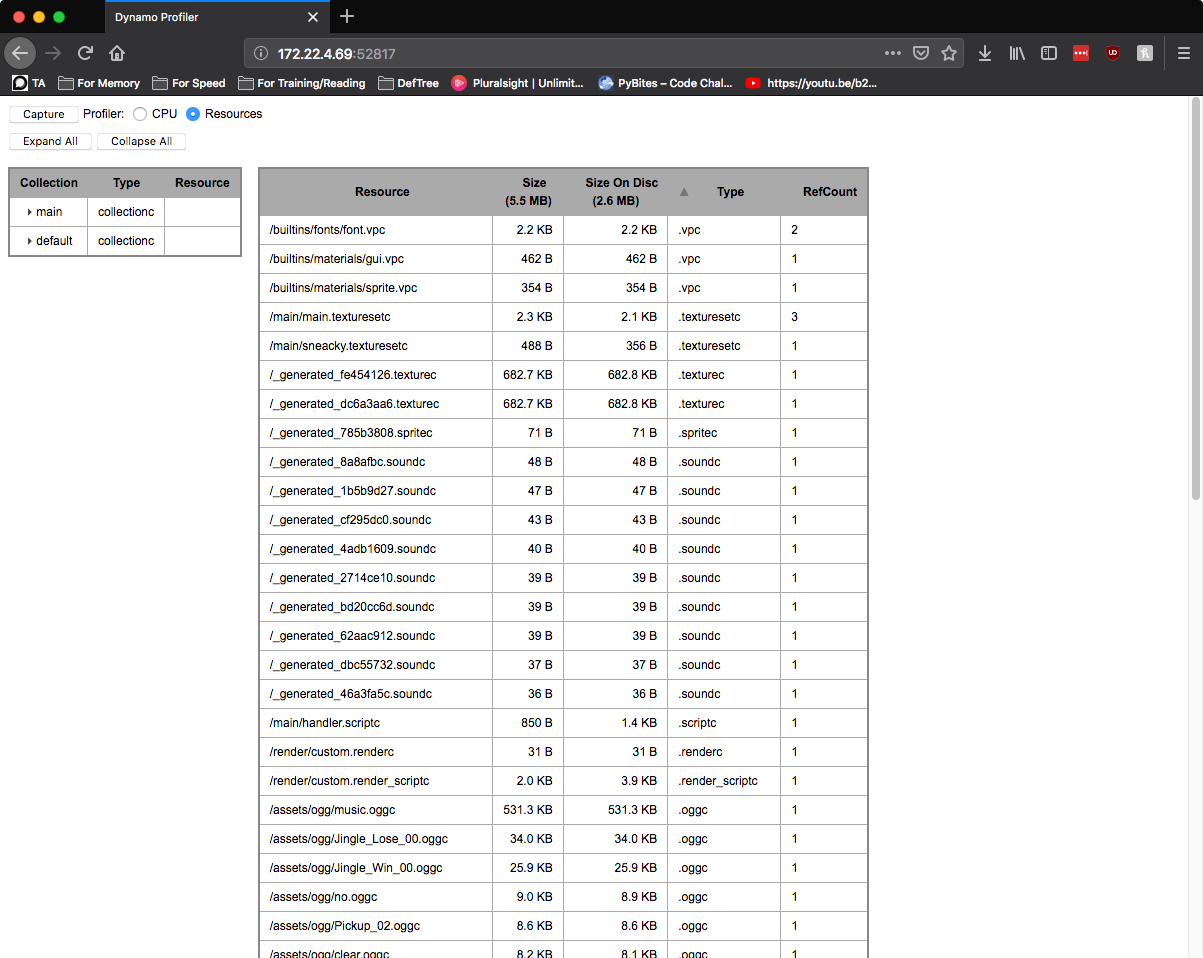
To see which textures are in memory we need to look for .texturesetc, don’t confuse this with the texturec . The .texturec is bigger and that is because that is the actual generated image. I assume that the .texturesetc is the atlas definition data. Sort on “Type” and check for .texturesetc. In my example above I only have main.texturesetc loaded.
A fast (but not 100% accurate) way to check if the resources is loaded is to open up the Resource view in the web profiler again. Then simply search for the resources. If we find the resource here it means it is loaded and we need to figure out why.
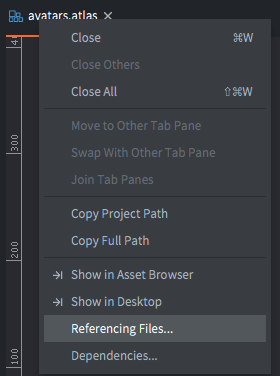
We can also check all texturesetc and reason about them individualy if they should be loaded. Doing that I realise that in this case I think that /main/sneacky.texturesetc shouldn’t be loaded. So now we need to figure out why it is loaded. The easiest way of finding out where it is used it to use Defold’s “Referencing files” tool. So now we go back to Defold and use “Open Asset” and search for sneacky, then we simply right clicking on the tab of the file (or on the file in the Assets view) and selected the menu option “Referencing files”.
We now get a list of where it is included, so only thing left is to track down from which of all these places it is loaded from. To do this you need to go down the list of every resources to see which of them in turn is used and how. Remember that a gui that uses a resource indirectly (by using a template of a resource that uses it directly) does not show up in the list.
There are a few different ways to load a resource so you need to figure out how it is loaded into the game.
Component File
This includes the referenced collection (or game object, gui or other) in your collection without having the need to dynamically load it. If the scene should be dynamically loaded change it over to a Collection Proxy or Collection Factory.
Collection Proxy
A collection proxy is only loaded if it get a “load” or “async_load” message. Thus if you have a collection proxy that’s loaded even though you think it shouldn’t you need look in your code for when it loads the collection proxy.
Collection Factory
If your resource is loaded in by a collection factory and you don’t want it to always be loaded you can turn on “Load Dynamically” on the properties. If that doesn’t help and it is still loaded it means you do a
collectionfactory.create or collectionfactory.load.
Factory
If your resource is loaded in by a factory and you don’t want it to always be loaded you can turn on
“Load Dynamically” on the properties. If that doesn’t help and it is still loaded it means you do a
factory.create or factory.load.
Example
By checking the web profiler I see that we have an atlas loaded even thought it shouldn’t, I want to find out why and hopefully fix it. I start with finding it in Defold and then checking its Referencing files. A bunch of gui files shows up. I now go back to the web profiler and search for them there, I find out which of the gui scenes are loaded. Now I open up them in Defold and show the referencing files. My gui scene is in a collection proxy so I open that and check the referencing files again. This one points to a bootstrap collection that loads the collections with Factories so we can simply turn on “Load Dynamically” in the factories properties.
Texture Size
One of the mayor attributes that dictate how much memory a texture uses is the actual size. You can easily calculate the size in memory yourself. Given that you are not using mip-maps you calculate it with width * hight * channels, so one of the easiest way to decrease the memory size it to make your atlas smaller. Make sure that you are using all the images you have on your atlas and also make sure they are of an appropriate size.
Example:
A square atlas of 2048 with alpha will take 2048*2048*4 = 16777216bytes or 16.8MB
If the same texture have mip-maps it will be 2048*2048*4 + 1024*1024*4 + 512*512*4 + 256*256*4 = 22282240bytes or 22.3MB
Texture format
Format tells which channels should be included and if you are using an hardware compression, it is essentially how much memory the images will consume. RGB means that the alpha will be discarded, if your images uses alpha and you use this compression where there was alpha before there will now be black. If you images have alpha you want something that have RGBA.
LUMINANCE is a grey scale image so it only uses one channel, if you put in an image with RGB values in an atlas with this format the color of each pixel will be calculated with (something along the line of) 0.3*R+0.59*G+0.11*B this is to represent the colors in a way that takes how the eye works in account.
PVRTC is a hardware compression format for PowerVR GPUs, main usage is for iOS. There are two alternatives for it 2BPPV1 (2 bit mode) or 4BPPV1 (4 bit mode).
ETC1 is a part of the OpenGL ES graphics standard extensions and is mainly used for Android. Note that there are no support for alpha with the ETC1 format.