Yes, you’re correct. Unless you wanted to change some things like the color, add graphics, change the default size… etc.
If you have any other UI modules, this could be bundled in the script with them. I have a UIModules.script with several different functions that make calculations, fit text to certain boundaries and insert line breaks, etc. So I put it along with them because it was related to UI. But this is absolutely fine–I just mentioned all that for organization’s sake.
Alright, you’d have to wire this differently then. What I mean is you’d have to detect which turret was pressed and use that to change each individual turret’s values. I touched a little bit on this inside the GameObject.script, which is listed below.
This just gets the file path. I haven’t tried using periods to file search, but it may be a substitute for “/”. The first slash tells it to start at Game.project, then continue to main file, then the GUI file, and then the on_button_message script. Put the script wherever you want, but make sure you change the file path to the correct one.
I tried doing as you asked, but I couldn’t figure out how to make a repository. I MacGyvered it although, and made it as close as I could.
I posted the files, editing some things that I realized wouldn’t work for you. The main.collection file is an example showing how the collection should be laid out.
Another thing I realized is that I haven’t tested it for reproducing buttons. It will make them once, but then they cannot be recalled correctly. Sorry about this, I really should have spent more time and made sure it was finished before posting it as an example.
Can you fix it to have basic working functional? i.e. create default buttons near objects with click on them. It would be super-duper cool! At the end we can update repo so everyone can use it in their projects. Thanks!
P.S. I am really appreciate of your help already! Thank you!
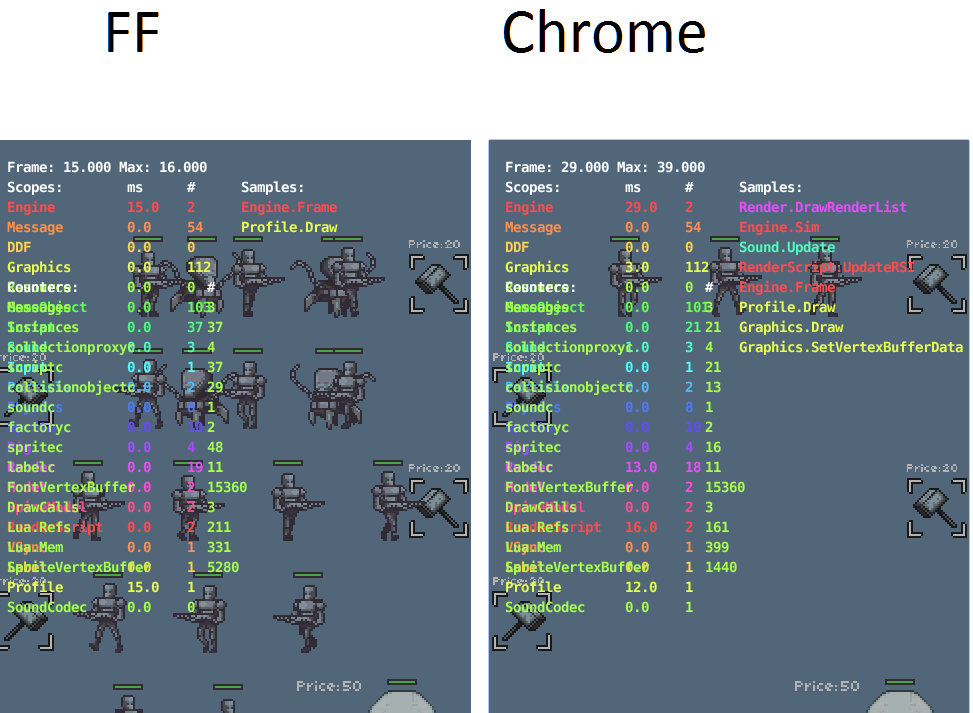
Updated version with working buttons (now you can turn turrets on/off) Everything works like it should but my code… god… that’s ****ing mess. Google Chrome doesn’t like it and lags as hell, but Firefox seems to work m… well. So yes, use Firefox.
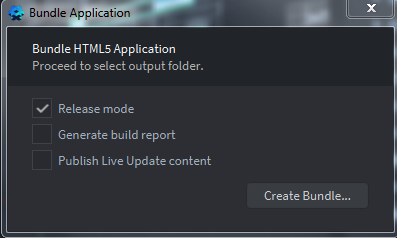
The performance difference could be that you are running in debug mode. I chrome, the glCheckError in the engine slows it down quite a bit. Bundle a release version an try that instead!
So, now one may win or lose (at last). Main menu with instructions added.
Still lags in Chrome. Any suggestions of how to spot what exactly causes lags? What debug features may help me in this? (I’ve already checked release version).
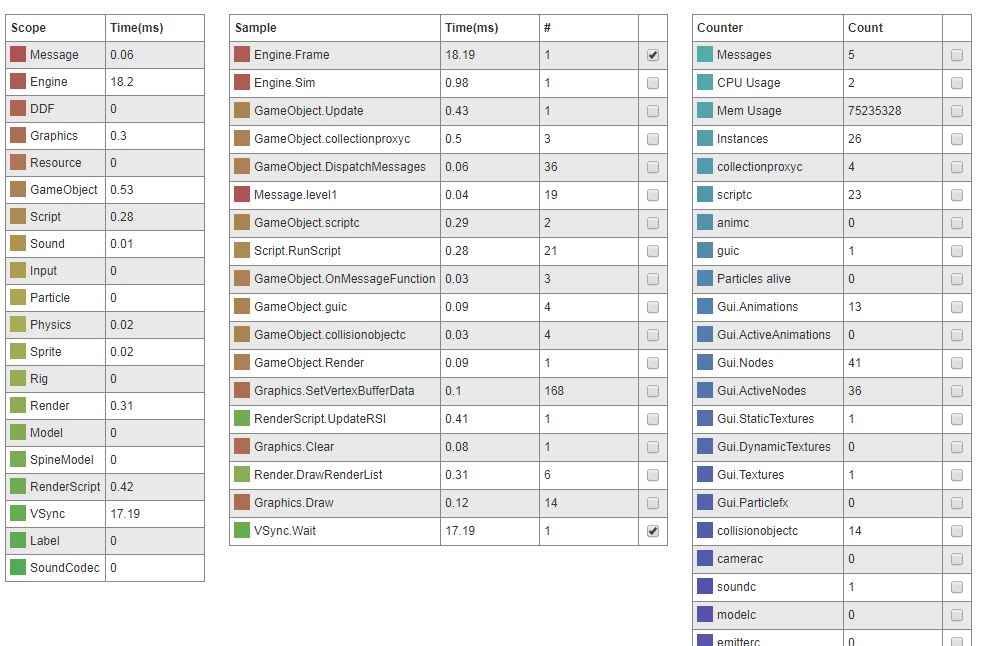
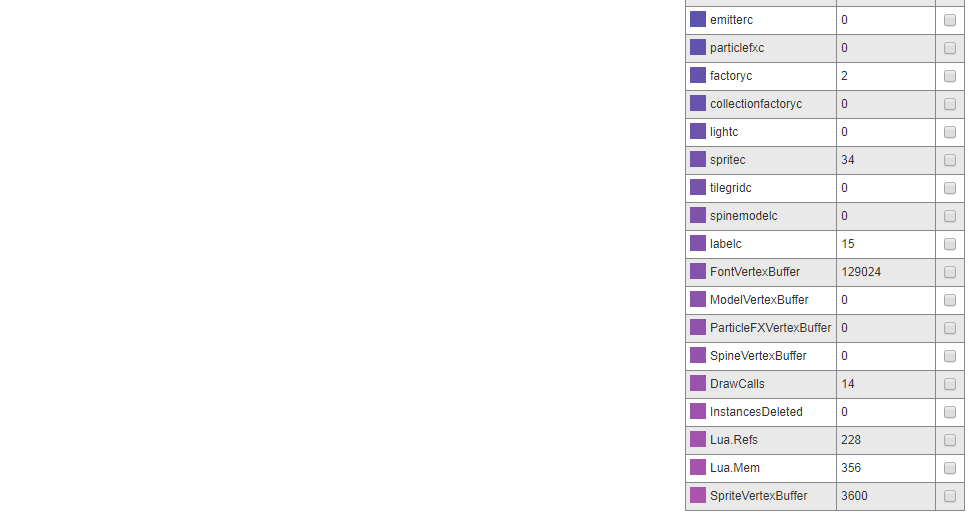
My suggestion would be to use the web profiler on when building and running from within the editor and look at things such as draw calls (in the right column named counters). Note that the web profiler doesn’t work for HTML5, but running it against a desktop build will at least give you an idea of the resource counters of your project, with draw calls being of interest since many draw calls will have a negative impact on performance.
You can also try the visual profiler for HTML5 to get an idea of where you’re spending your time. The visual profiler is harder to read since it fluctuates a lot.
There is probably also some HTML5/webgl profiler tools that can be used but I’m not sure which ones…
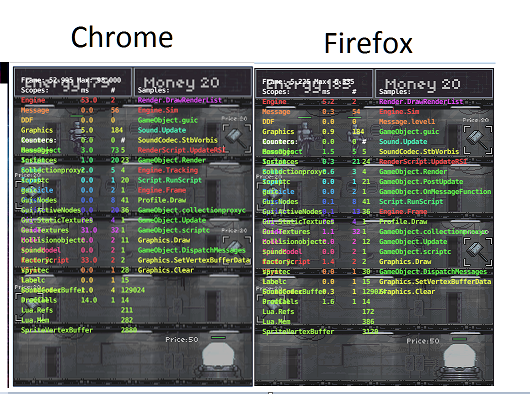
It seems that in Chrome “render” and “render script” (“engine” also) are different from Firefox ones. So I tried to return default render script but that doesn’t help.
Also, GameObject field differs a lot. # ~50-90 in Chrome and ~1-5 in Firefox. What could this mean?
So, maybe someone may guide me with some further steps? Thanks!
Hmm. yeah. not sure what’s going on with the huge difference between Chrome and Firefox. You are using a release build right? You have 14 draw calls for something that should only require 2 or 3 draw calls. On web you want to minimise draw calls as much as possible. Have you read this post?
Release build, yes. 14 draw calls - mainly, that’s because I don’t use layers for GUI. Build with no GUI and no turrets, but still lags (but actually this build is little bit smoother).
I’ve deleted all the extensions - still lags. Deleted all the game objects 1. except the turrets 2. Except the mobs - still lags. So, maybe something’s wrong with the way I use images and atlases?
I don’t use tiles. I have 7 atlases:
Background and light
HP bar
Mob1
Mob2
Reactor
Turrets
Laser
Now I realise that this is too much but may this cause lags in Chrome? I didn’t test it with fewer atlases yet. So, should I rebuild my image structure or this amount of atlases can’t cause lags and everything’s fine?
You want to aim for as few atlases as possible while maintaining an atlas size below 4096x4096 pixels. There’s a discussion on atlas sizes in another post. You might want to consider using 2048x2048 atlases but it depends on your target group of users. I’d say 4096x4096 is good since it is handled by almost all existing hardware today.
Okay, now I have only one atlas for all images and also one tilemap for background with one huge tile (is this ok? Or one should use tiles as tiny as possible?). I’ve deleted GUI for testing (background also). Now I have only 3 draw calls. Now Chrome lags at first but then (make window of Chrome not fullscreen and then again fullscreen helps) - everything seems fine.
Adding the gui should result in two more drawcalls (one for the button bg and one for the text) if you have created your gui properly. You need to use GUI layers to reduce the number of draw calls. This is mentioned in more detail in the post I linked previously.
Yes, thanks. I’ve used this approach and now I have 6-9 draw calls. But Chrome still lags. Latest build.
One more thing, when I “Build HTML5” from editor - absolutely no lags in Chrome. Absolutely. But if I build with Bundle lags will appear. And yes, I am absolutely sure about release checkbox.
But variable Dt is causing some funny bugs. For example, now one of the mobs just teleported 4 floors down. Wut?
I have this code for moving mobs:
	local p = go.get_position()
	-- apply the speed
	p.x = p.x + self.speed * dt * self.direction
	go.set_position(p)
	if p.x >= 204 or p.x <= 39 then
		p.y = p.y - 56
		self.direction = self.direction*-1
		if self.direction == -1 then
			sprite.set_hflip("#mob1", true)
			sprite.set_hflip("#hp", true)
			sprite.set_hflip("#mob2", true)
		else
			sprite.set_hflip("#mob1", false)
			sprite.set_hflip("#hp", false)
			sprite.set_hflip("#mob2", false)
		end
		go.set_position(p)
	end
As I can understand, because of the variable Dt is on, if statement of the script is executed several times in a row, not only once. How to avoid this?
One more interesting thing. Because of Variable Dt Chrome version is much more challenging to play now. Any suggestions?
