Know your engine limitations!

While we’re continuing to prototype features for our game “Smash Bash: Date with the Desert”, I do some tests for knowing limitations of the engine. Here I want to share some results.
One of the common cases for our game is a lot of objects at the screen: heroes, zombies, enemies, bullets, effects, objects of dynamic and static environment.

**ZOMBIES!!!**

There are many post about the fact, that Defold does not fit for real time simulation using Lua. So, I’ve decided to compare how far we can go using Defold engine and another one - Unity.
For comparison I’ve implemented simple tests using Defold 1.2.107 and Unity 5.6.0p1. For measuring I’ve used my old good iPad 2 (iOS 9.3.5) and Xcode.

First test is performance of a lot of objects with logic.
I spawn a bunch of objects at random position of the screen. Each object moves in a random direction and bounces off the screen frame.
You can tap on the left part of the screen to decrease number of objects and on the right part - to increase it.
Source code is available here: Defold, Unity.
There are two cases:

  1. Each object include its own script component for moving.
  2. There is one object, which has the responsibility for moving the spawned objects.
    Note: before getting the results from the table I’ve removed a sprite component from spawned object.
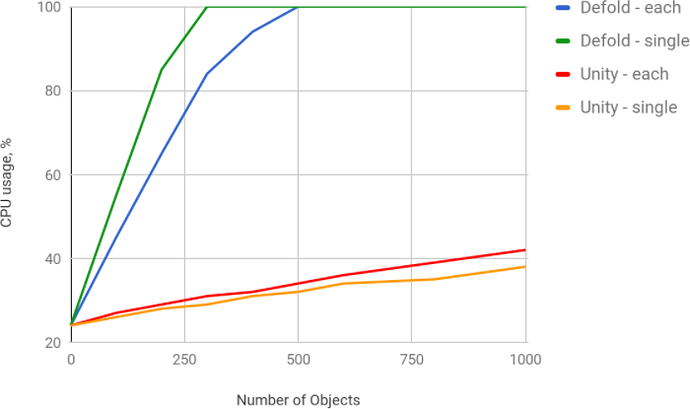
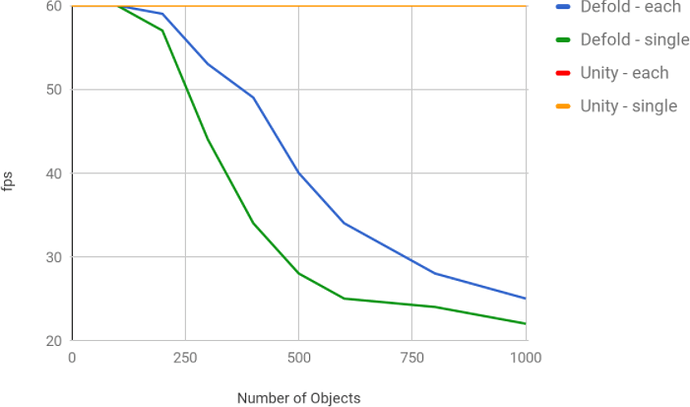
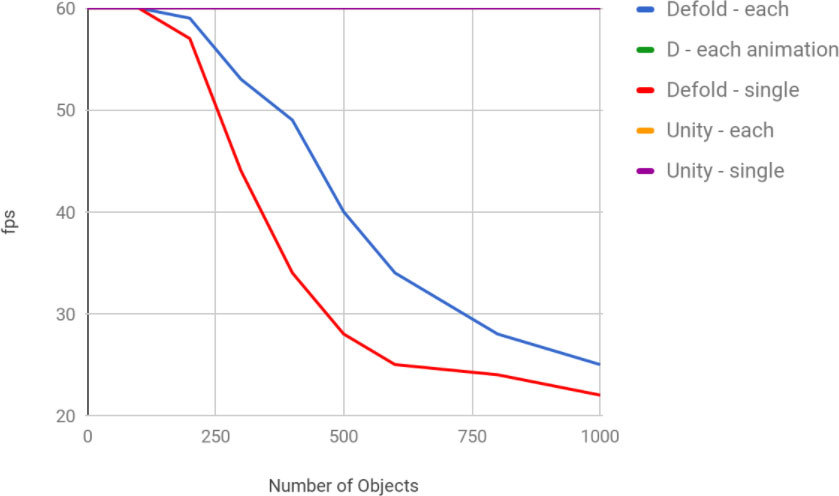
    Results:


Table with data
Don’t use real-time simulation on Defold (at least, with Lua language). It’s much better to use the engine to make asynchronous gameplay. For example: puzzles or turn-based strategies.
(Maybe I will try to move simulation logic to native extensions and then measure it again.)

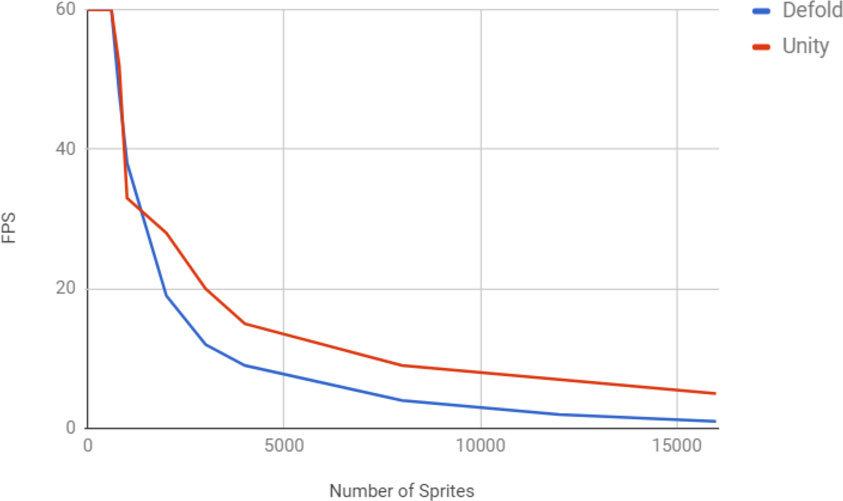
Second test is the impact of a large number of objects with sprite components on performance. Images for sprites are identical.
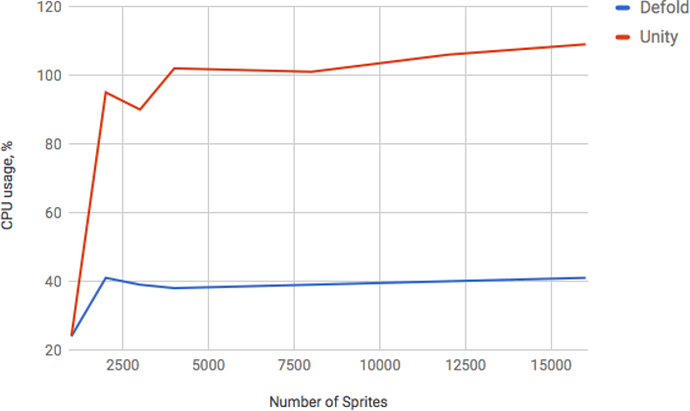
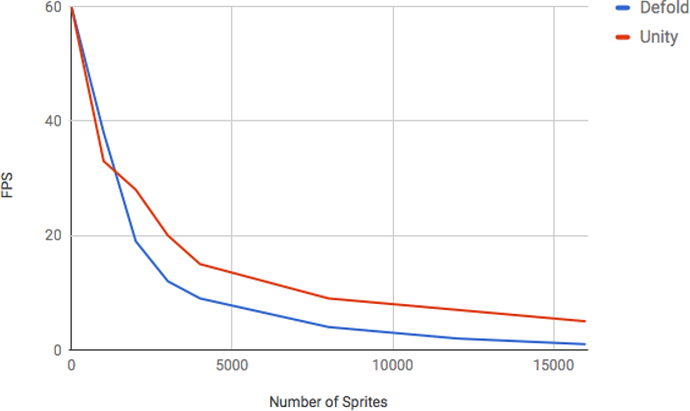
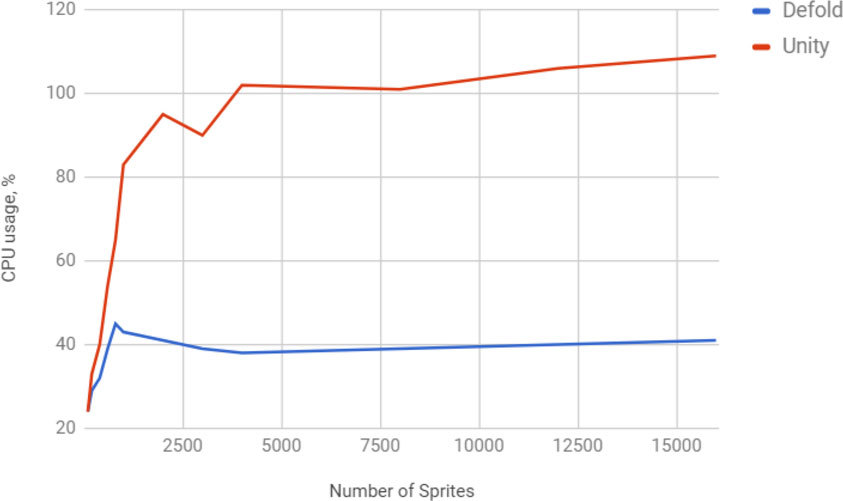
Results:

Table with data
It’s hard to do right conclusions without any data on GPU usage, but it looks like Defold has some bottleneck and its not on the CPU side. Data transfer to GPU? Any thoughts?
Unity uses CPU for rendering more actively, even in several threads.


What instruments do you know for profiling cpu, gpu, ram and battery usage on Android/html5 which are independent from game engine? I’d like to hear any criticism, suggestions, questions!


19 Likes

Hmm… it looks like spoiler is not working with images. Strange: at the preview everything is alright.

Thank you for the thorough comparison! There’s a couple of important things to know about Lua on mobile:

  1. It’s not allowed to run JIT compiled code on iOS.
  2. We use plain Lua 5.1 on 64-bit ARM CPUs. This is the slow version of Lua (when compared to LuaJIT). This will be somewhat compensated by the powerful CPU on newer iOS devices.
  3. We use LuaJIT with JIT disabled on 32-bit ARM CPUs. LuaJIT is still faster than plain Lua 5.1, even with JIT disabled.

Point #2 can be solved by an upgrade of LuaJIT (this is already in the backlog) but we can’t get around the fact that JIT will be disabled on iOS. This means that it’s important to think about how much code you run each frame and how. It will always be better to let the engine animate things instead of animating using Lua code, and it’s always better to have a single script that updates many game objects (as opposed to one script per game object).

9 Likes

Try to run your project on android, for some reason it not working=)
what if your make some changes in script.
1)use self.pos=go.get_position() in init instead of go.get_position() in update
go.get_position() return new vector every time.
2)Also change vector sum and multiply to avoid creation of new vector.
Maybe one part of defold slow speed is gc?

3 Likes

This is very good advice. It will likely have quite a big impact on performance.

2 Likes

Try to run your project on android, for some reason it not working=)

Sorry, there was an issue (Editor 2 suggests me remove [input] section) and I forgot to push fix for it. Now it is working.

what if your make some changes in script

I will try it, but this logic is only example. In the real project in this place a lot of different things are performed:

  • movements,
  • custom collisions,
  • ai,
  • etc.

What versions are using LuaJIT and what versions - plain Lua?

1 Like

I understand that, I interested is that lua performance problem, or GC problem.

Thank you!
It’s interesting. I need to find instruments for profiling other platforms!

  • On iOS/OSX you have Instruments.
  • On Android you can do quite a bit of profiling using Android Studio (remember that debuggable must be set to true in AndroidManifest.xml, it is hardcoded to false in Defold games)

Why not try on OSX using Instruments?

2 Likes

I’ve already used Xcode profiler for CPU and RAM and “core animation” preset from Instruments for FPS measures. But yes, only for iOS. I will try, but I’m afraid that laptop have enough performance for hiding all pitfalls, unlike the old tablets.
I’m more interested in tools for profiling on android and html5.

1 Like

Would be great to have one more example where instead update function your are use go.animate (it will be in accordance with Defold recommendations about reactive coding)

1 Like

It will be absolutely different test, but yes - looks like it deserves my attention.
Something like: engines performance comparison, when you use reactive coding paradigm.

5 Likes

Very interesting. I’m very surprised by the figures for the sprite-test, are you sure they are correct? The curve for CPU-usage should be linear in Defold, it looks really strange that it flattens out… Almost like the app was throttled by the os… which also could explain the FPS drop. We certainly need more cycles the more sprites there are to render.
Because of render-batching, we are more CPU-heavy than we need to be when drawing sprites, with the benefit of decreasing draw call count, which is a huge benefit on low end devices. It’s of course not heavy though, more along the lines of generating particles into a vertex buffer. It also means that we send the full vertex buffer to the GPU every frame (also like a particle system would do). This makes the FPS drop even more surprising. Could you try to test with more fine-grained samples, like [0, 100, …, 1000]?

If you’re up for it, it would also be really interesting to see how we compare in spawning shit. :slight_smile:

Regarding battery, I think the only safe way is to measure the physical properties of the batteries. Not very easy though.
I haven’t used them myself, but I got the impression there are some pretty good tools for profiling webgl and html5.

7 Likes

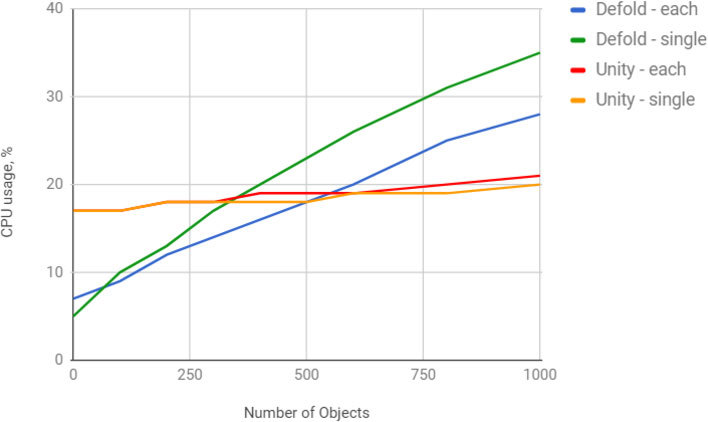
So, here are the results for OSX. Only for CPU, because all fps value are equal to 60.


Table with data

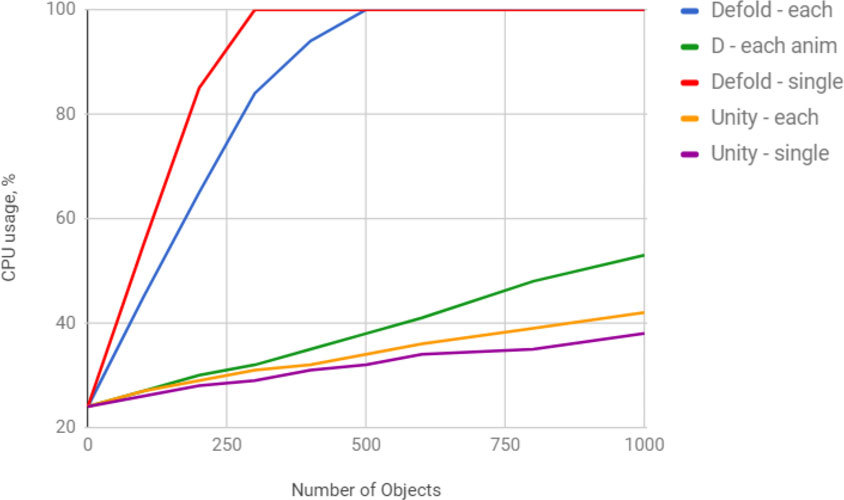
Results for a test with usage go.animate function. Code is here


Table with data
(There is a new column: Defold - each animation)

3 Likes

Ah, this is better. Using go.animate should give a lot better results, and the graphs back up that claim!

And here some additional data for second experiment with a lot of sprites


Table with data

5 Likes

Hmm, the CPU graph for Defold looks really strange. Why is it flatlining at around 40%?

What was the target device?

1 Like