Crash on exit when animation is running (SOLVED)

Test project.
easingbug.zip (904.6 KB)

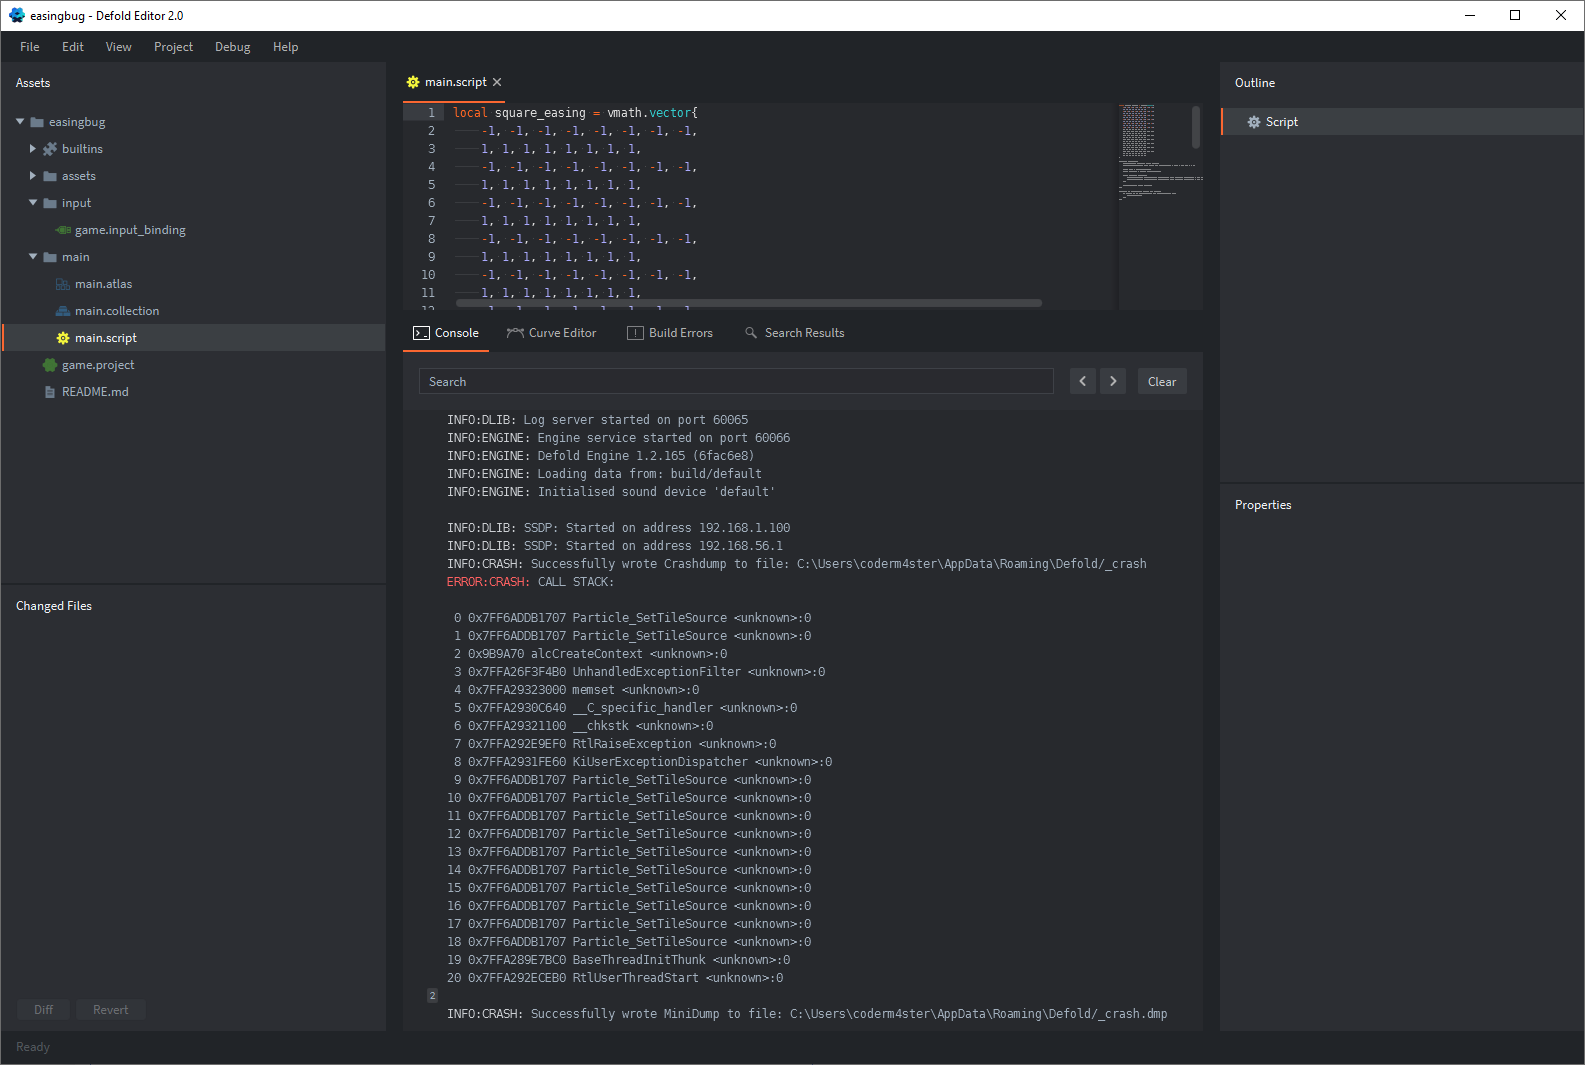
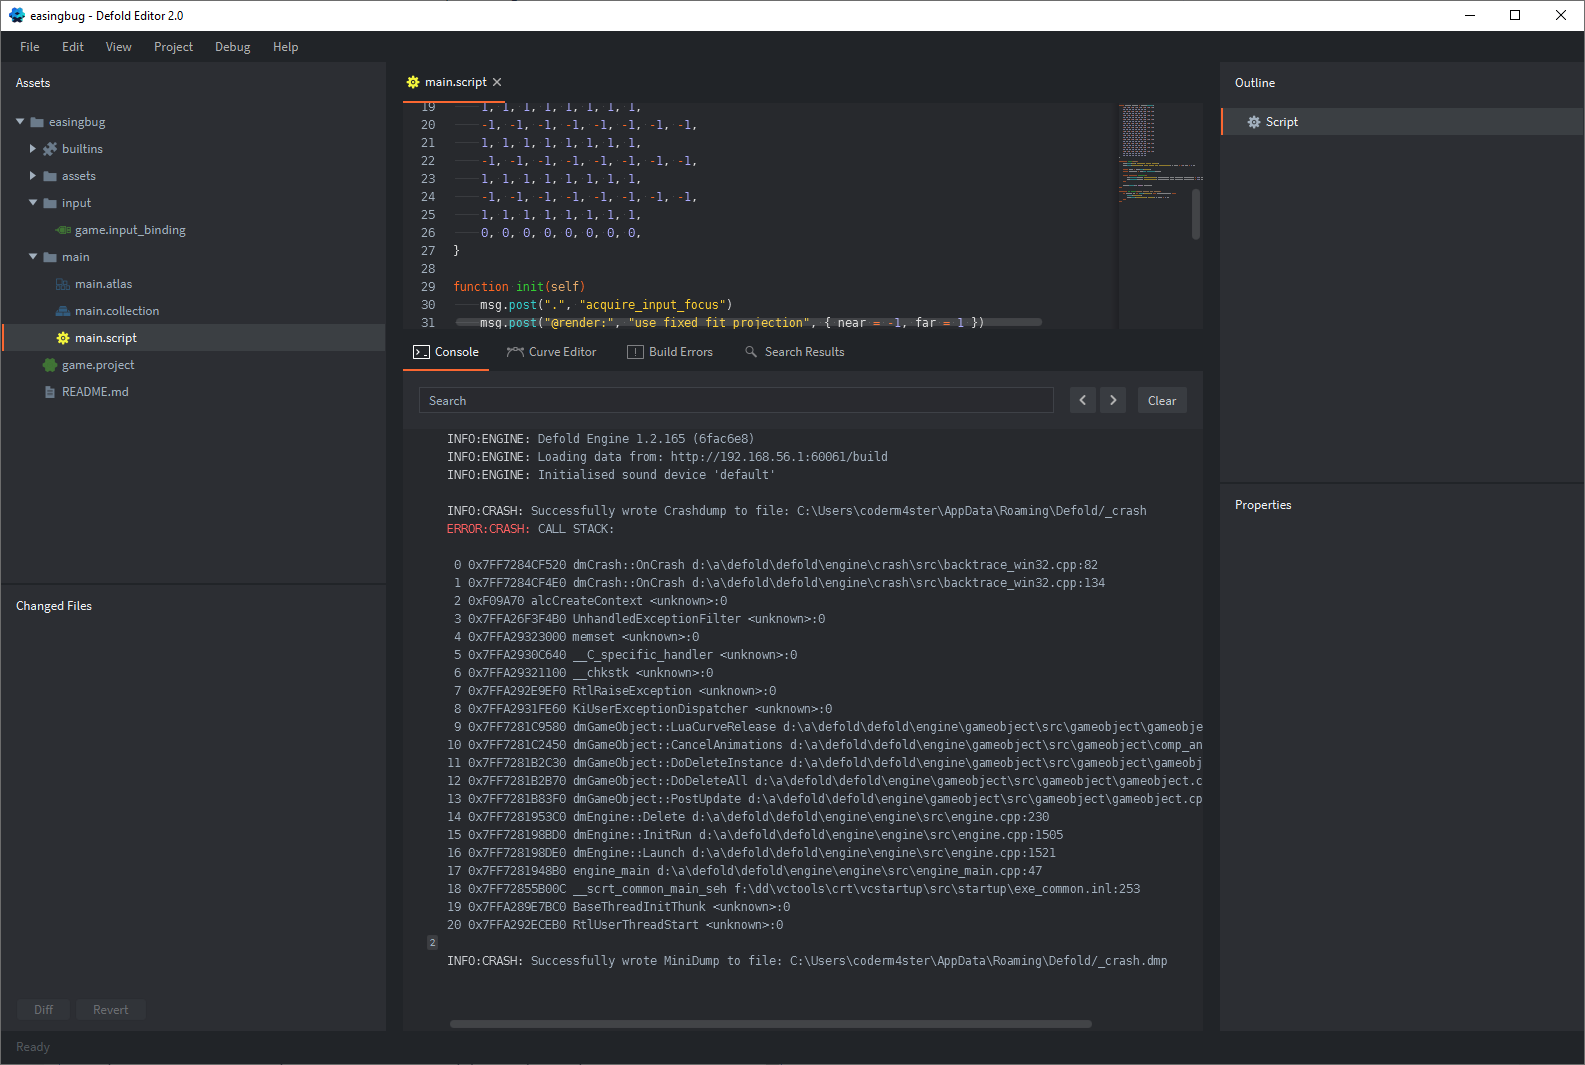
Close window when animation is running.

Thread 0 Crashed:: engine_main  Dispatch queue: com.apple.main-thread
0   dmengine                      	0x0000000107c03704 dmGameObject::LuaCurveRelease(dmEasing::Curve*) + 20
1   dmengine                      	0x0000000107bf02ab dmGameObject::CancelAnimations(dmGameObject::CollectionHandle*, dmGameObject::Instance*) + 347
2   dmengine                      	0x0000000107bfd8b3 dmGameObject::DoDeleteInstance(dmGameObject::Collection*, dmGameObject::Instance*) + 35
3   dmengine                      	0x0000000107bf39b1 dmGameObject::DeleteCollection(dmGameObject::Collection*) + 81
4   dmengine                      	0x0000000107bfc045 dmGameObject::PostUpdate(dmGameObject::Register*) + 165
5   dmengine                      	0x0000000107bde002 dmEngine::Delete(dmEngine::Engine*) + 50
6   dmengine                      	0x0000000107be1a92 dmEngine::Launch(int, char**, void (*)(dmEngine::Engine*, void*), void (*)(dmEngine::Engine*, void*), void*) + 242
7   dmengine                      	0x0000000107be1e7f engine_main(int, char**) + 143
8   dmengine                      	0x0000000107bddab4 start + 52
1 Like

On Windows 10:

ERROR:CRASH: CALL STACK:
 0 0x7FF7E1561707 Particle_SetTileSource <unknown>:0
 1 0x7FF7E1561707 Particle_SetTileSource <unknown>:0
 2 0x369A70 alcCreateContext <unknown>:0
 3 0x7FFA26F3F4B0 UnhandledExceptionFilter <unknown>:0
 4 0x7FFA29323000 memset <unknown>:0
 5 0x7FFA2930C640 __C_specific_handler <unknown>:0
 6 0x7FFA29321100 __chkstk <unknown>:0
 7 0x7FFA292E9EF0 RtlRaiseException <unknown>:0
 8 0x7FFA2931FE60 KiUserExceptionDispatcher <unknown>:0
 9 0x7FF7E1561707 Particle_SetTileSource <unknown>:0
10 0x7FF7E1561707 Particle_SetTileSource <unknown>:0
11 0x7FF7E1561707 Particle_SetTileSource <unknown>:0
12 0x7FF7E1561707 Particle_SetTileSource <unknown>:0
13 0x7FF7E1561707 Particle_SetTileSource <unknown>:0
14 0x7FF7E1561707 Particle_SetTileSource <unknown>:0
15 0x7FF7E1561707 Particle_SetTileSource <unknown>:0
16 0x7FF7E1561707 Particle_SetTileSource <unknown>:0
17 0x7FF7E1561707 Particle_SetTileSource <unknown>:0
18 0x7FF7E1561707 Particle_SetTileSource <unknown>:0
19 0x7FFA289E7BC0 BaseThreadInitThunk <unknown>:0
20 0x7FFA292ECEB0 RtlUserThreadStart <unknown>:0
1 Like

Excellent, thanks!

1 Like

@coderm4ster that looks like crash related to particle effects. Can you share a repro case?

The repro case is easingbug.zip uploaded by @sergey.lerg . On Windows 10, print this call stack if I close the program while the animation is running.

1 Like

Are you sure? The example shared by @sergey.lerg does not use any particle effects and the crash log you shared clearly shows that it is a crash with particle effects.

Yes, sure :slight_smile:
If it helps you, I can send you the _crash.dmp file shown.

1 Like

Yeah, I think that “particle” callstack is just very broken, which can happen when memory gets corrupted which is probably the case in this issue.

.
.
B̴̳̟͓̪̑͋̀̋͌͐̀̀͡ͅù̢̖̙͎̟̗͔̞̑̊̀̀͆͂͘͜f͙͈̦̬͈̞̈̉̽̓̏̓͂̐͞͞f̢̨͖̺͔̬̩́̅̆͌͋̀̈͘ȩ̧̡̡͈͙̠̰̊̍͒͊͋́́͢͞͡ͅr̶̡̪̪̳͙̼̭̞̈́̀̐̓̔͌̓͑͢͢ O̴̧̢̖̼̬͂̃̆͆̈̓͢ͅv̢̛̱͎̯̯͊̏́̈́͊̀͐̄͝e̛͍̯̘̫̻͎͎͙̜͐͂̄̀̚͜͠ȓ̪̤͇̦̠͖̣͋̈̇̈f̢̥̰̪̅͊̃̐̊̎̋̎̉ͅl̻͎͎̙͎̻̟̬͋́̓̕͞o̠̙̗̞̲̱̖͙͛̂̑̎͊͝ͅw̬̫͇̦̲̣̰͈̬͊̆̍͗̆̎̇͌̀̚
.
.

2 Likes

It’s possible, but in this case, I should see the original error that @sergey.lerg showed, didn’t it?
However, as I see it, he did not copy the error from the editor.

Windows and Mac engines have slightly different memory layout because different platforms. On HTML5 it might be something else.

Yes this is true, but basically I should see the same call stack on all systems when viewed in the same context. Can I ask you from what environment did you copy the error?

Call stack is generated when the corrupted memory is used, not when it’s generated, so that can be two completely different places.
It’s from macOS crash report dialog.

Thanks! I’m assuming you’re using a dmengine that contains debug symbols, and I’m using a built-in that doesn’t contain debug symbols and that’s why we see different call stacks. I’ll try something…

And yes, it did. I downloaded the standalone dmengine.exe from the Defold download page (http://d.defold.com/archive/6fac6e80f09ab297093e3ff65a7f45ad56e06e33/engine/x86_64-win32/dmengine.exe).

If I run this and select this as the target in the editor, I will see the same as you. Obviously this release contains debug symbols. You might also want to enable this in a runtime environment launched by the editor.

All our builds have debug information built into them.
The only time it gets stripped is when you do bundling (and only for some platforms)

There are several issue with creating a good callstack: Non corrupt memory, Jit’ed code, longjumps etc.
So there are multiple ways it can go wrong to produce a callstack, and you’re not always guaratueed to get a similar callstack as another user.

Yes, many circumstances can affect the content of a call stack. The key here is the last statement before the untreated exception, indicated by the following line:

0x7FF74F4E9580 dmGameObject::LuaCurveRelease d:\a\defold\defold\engine\gameobject\src\gameobject\gameobject_script.cpp:1234

I think this line (or something similar) should appear on every system and I missed it on my first screenshot. Why, in this case, the particle line appears in the call stack. I figured out the solution.
I binary compared the downloaded dmengine.exe to the built-in (uncompressed) version and they are completely the same. However, when I ran the two dmengines separately, different call stack contents were created but they were each consistent. At first I didn’t understand the difference but I noticed that besides the downloaded dmengine.exe I also downloaded dmengine.pdb. So if I run dmengine.exe with dmengine.pdb in the same directory, it will print the line above in the call stack, otherwise it will not.
I thought if I copied dmengine.pdb to the directory containing the built-in dmengine.exe and running it from the editor would be fine, but not. For some reason, it can’t find pdb, but if I run it as a standalone then it’s fine.

Sorry for the lengthy posts, I just like to see clearly :slight_smile:

1 Like

I have found and fixed the issue and made a PR. It’s a small change so we should perhaps be able to include it in the current beta.

1 Like

Solved in 1.2.166

2 Likes