Why does this game look choppy if it's at 60 FPS? [SOLVED]

Hi. New Defold developer here…

I was playing the Sidescroller tutorial project and noticed that it seemed like the framerate was a little low. It’s not unplayable but the movement of the stars is not at all smooth like I hoped it to be.

I checked the project’s update frequency and saw that it was set to 60. This doesn’t seem to be consistent with what I’m seeing on screen so I wrote a little script in the GUI to display what the current framerate is.

function init(self)
    self.score = 0
    self.frame_time = 0;
    self.frame_counter = 0;
    self.score_node = gui.get_node("score")
    self.framerate_node = gui.get_node("framerate")
end

function update(self, dt)
    self.frame_counter = self.frame_counter + 1
    self.frame_time = self.frame_time + dt
    if self.frame_counter > 100 then
	    local framerate = self.frame_counter / self.frame_time 
	    gui.set_text(self.framerate_node, tostring(framerate))
	    self.frame_time = 0
	    self.frame_counter = 0
    end
end

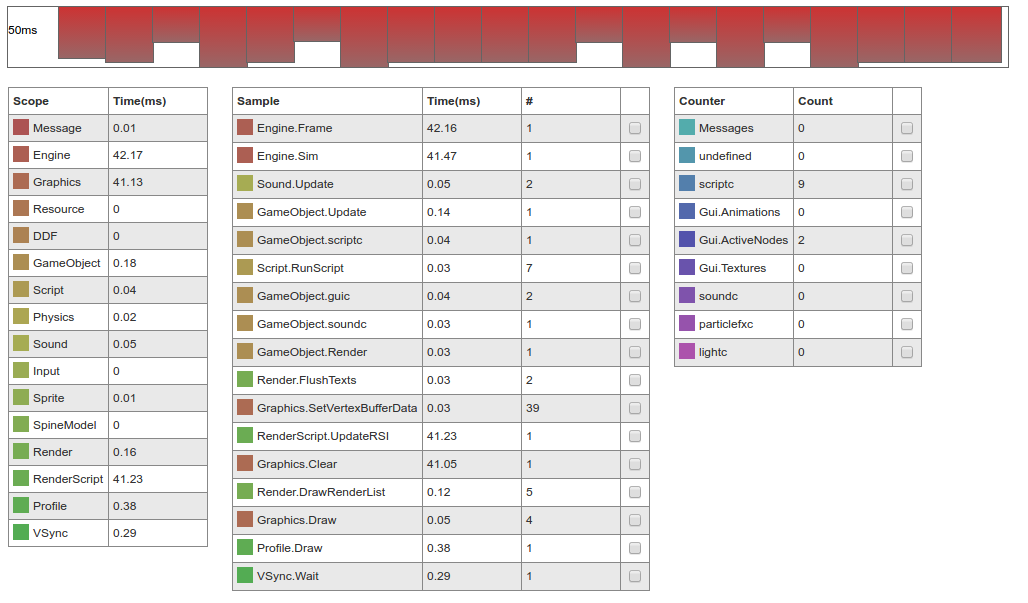
This script appears to work, and is reporting that the framerate is approximately 59 fps. Strange.

Now, I anticipated the possibility of the project running slowly. I’m actually running it on a Chromebook which has Linux installed on it, so I expected it. However, what I didn’t expect was for Defold to report the framerate to be high when it’s clearly not.

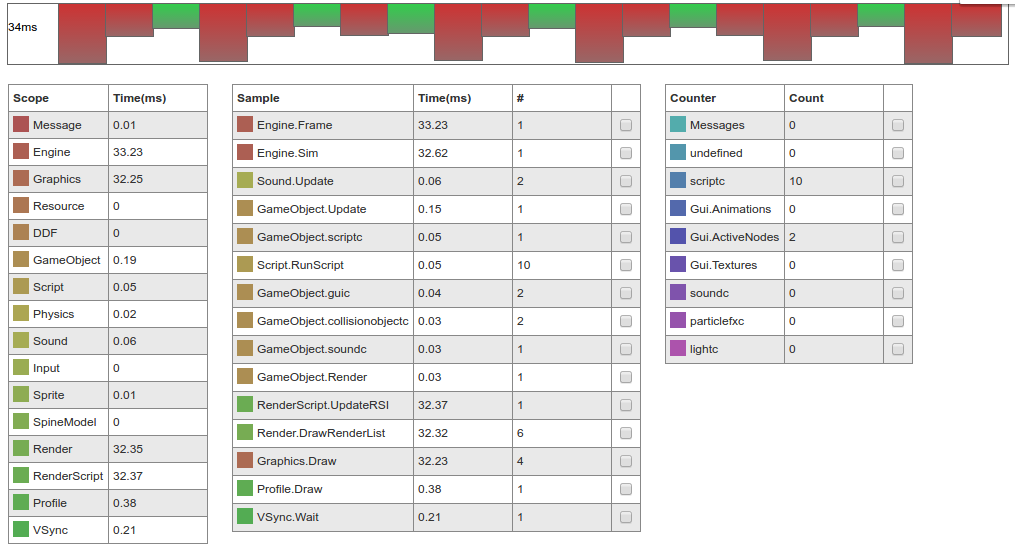
Also, another unexpected thing that happened was, when I turned update frequency down to 30, the game actually appeared to get smoother.

My question is: how can this be? Is the rate at which Defold draws to the screen separate from the rate at which it calls update()?

Update: I put some framerate calculations into the render script. It turns out that the render update() was getting called approximately 20 times per second…

Here’s a weird thing: my system’s resources were nowhere near their maximum load. While playing the sidescroller game I was using very little memory and CPU usage was hovering around 50%.

Here’s the REALLY weird thing: the framerate goes to 60 fps and the game looks silky smooth when the game window is out of focus. What the heck?

My computer is an Acer Chromebook C270, running Lubuntu 16.04… has anybody else ever run into problems like this?

Have you tested turning on variable_dt in your game.project?

Yes, I tried toggling that and that didn’t seem to fix the issue. :frowning:

Hmm, sure sounds strange. @Mathias_Westerdahl, @Andreas_Tadic and @sven, any ideas?

Could you try turning on the visual profiler and see if there is anything taking more time than expected?

If the game runs fine out of focus you should start by looking at the graphics drivers, or possibly the OS. PCs like netbooks and cheaper laptops are infamous for poor drivers when it comes to opengl. On a specific version of OSX, there was a similar issue where we had to move the window slightly off screen to get smooth 60 fps. They fixed that bug in a later version.

Setting the game update speed to 60 fps only means that we will wait for every 60hz vsync before moving on to the next frame. There is no software throttling of frames in Defold yet.
The dt received in update-functions is constantly 1/60 when variable_dt is unchecked and the actual frame time when variable_dt is checked. So you must have it checked in order to use it to show the FPS on screen. The profiler is much better at this however. Please post a dump of it when the game is jittery.
The game ran smoother at 30 fps because there was enough time to get everything done before drawing, thereby creating a more stable, although lower, render frequency.

5 Likes

Do your display drivers have any ability to control the behavior of specific apps?

So, the first update… earlier I reported that the game ran smoothly when out of focus. I was wrong about that–it turns out that the rule is actually that it runs smoothly when the window is partially obscured. This is beginning to sound just like a plain old performance issue (since there’s less drawing to do when there’s less window visible).

Here’s the output from the profiler… I don’t quite know how to interpret this data but it looks like the game takes too much time to perform some sort of engine update and render each frame, hence the choppy graphics… the ‘60 fps’ issue turned out to be a red herring–I don’t know why my calculations with dt (even with variable_dt turned on) are reporting that I am achieving 60 fps, since that is clearly not the case.

The confusing thing is I opened my system monitor and it looks like my GPU, the most intensively used resource in this situation, is still only reporting 60% load. That’s a question for a different community, however. If you all have any suggestions on tweaks that might achieve better performance on cheap hardware like mine, let me know!

I ‘upgraded’ my graphics drivers (‘upgrade’ in quotes because I had to use an open-source offering since my current setup is not officially supported by any manufacturer) and that didn’t fix the issue, unfortunately.

I’m not sure. Due to my weird set-up I don’t think I have much flexibility like that but I’ll look into it.

Do most other Linux games run normally?

Nearly all the time is spent clearing the graphics buffers (Graphics.Clear in the Samples list which is being called once per frame). That is doing glClearColor, glClearDepth, glClearStencil and glClear, i.e. 4 function calls and none of which should take anywhere close to 41 ms, even if you had a large resolution. There could be something like a locking problem going on where the game process is waiting for access to a shared resource (video memory), causing the delay. You could try to use a custom render script and remove render.clear from it, just to see if the fps goes up. But chances are whatever is causing this will still happen on the next call to opengl. If so, we would see the time move somewhere else, and that would also be interesting.
When it runs fine, does it also runs fine if you only obscure it by one pixel in a corner? I doubt its proportional to how much of the screen is covered.
I have no explanation for why you could not see an accurate fps using variable_dt. @sven, could you file an issue?

1 Like

On a positive note, if we deduct the graphics stall, the rest of everything running takes 1.12 ms to go through (equiv. to 900 fps), so it seems like your system is dealing with Defold really well! :slight_smile:

1 Like

I don’t have an extensive library of games that I play on my chromebook but I’ve never run into an issue quite like this. Most games run at an acceptable speed unless the system requirements for that game are quite high…

You were right–removing render.clear from the render script just moved most of that waiting time to Graphics.Draw instead!

The game only runs smooth when a certain portion of the screen is covered, but it seems like it only needs to pass a certain ‘threshold’ of having the window covered and beyond that point things are smooth. So it doesn’t quite look proportional but it’s also hard to tell.

By the way: I just tried out fullscreen for the first time and it runs perfectly in full-screen mode. So that’s pretty nice! I like windowed mode but at least I can get things working fullscreened.

2 Likes

I think I fixed it! As you might have guessed, I had to fix the problem via configuring my graphics driver. Sorry to bother you guys about it since it eventually didn’t turn out to be a Defold problem, but I learned a lot about the profiler and what a great community this is so I’ll count this as a win. :slight_smile:

Anyways, in case someone is googling and finds this thread someday in the future, here’s the information surrounding the problem and its fix.

I am running Lubuntu 16.04 on an Acer Chromebook C270. My graphics driver is i915. I fixed the problem by creating this file:

/usr/share/X11/xorg.conf.d/20-intel.conf

And making this the contents of the file:

Section "Device"
   Identifier  "Intel Graphics"
   Driver      "intel"
   Option      "AccelMethod"  "sna"
   Option      "TearFree" "true"
EndSection

I’m not sure what the problem was but “TearFree” was disabled and I guess turning it on was the solution…? I’ll report back if I find any more issues related to this.

6 Likes

Great to hear! No one should suffer from stuttering frame rates. :slight_smile: Tear-free would be the result from waiting for vsync, so maybe same thing? Odd choice of name though…

3 Likes

I hope noone minds me bringing this thread back to life. I have the exact same problem running on Windows 10 with a Gefore GTX 1070 and newest drivers. Going to fullscreen fixes the issue for me aswell so it might also be a driver setup thing but is there no way to resolve this? I don’t think I can expect any potential client to change his driver setup.

An interesting addition: just enabling the visual profiler fixes the problem partially. Seems to run smoother immediatly but that’s not really a fix :smiley: